> ## Documentation Index
> Fetch the complete documentation index at: https://docs.crewai.com/llms.txt
> Use this file to discover all available pages before exploring further.
# Traces
> Using Traces to monitor your Crews
## Overview
Traces provide comprehensive visibility into your crew executions, helping you monitor performance, debug issues, and optimize your AI agent workflows.
## What are Traces?
Traces in CrewAI AMP are detailed execution records that capture every aspect of your crew's operation, from initial inputs to final outputs. They record:
* Agent thoughts and reasoning
* Task execution details
* Tool usage and outputs
* Token consumption metrics
* Execution times
* Cost estimates
 ## Accessing Traces
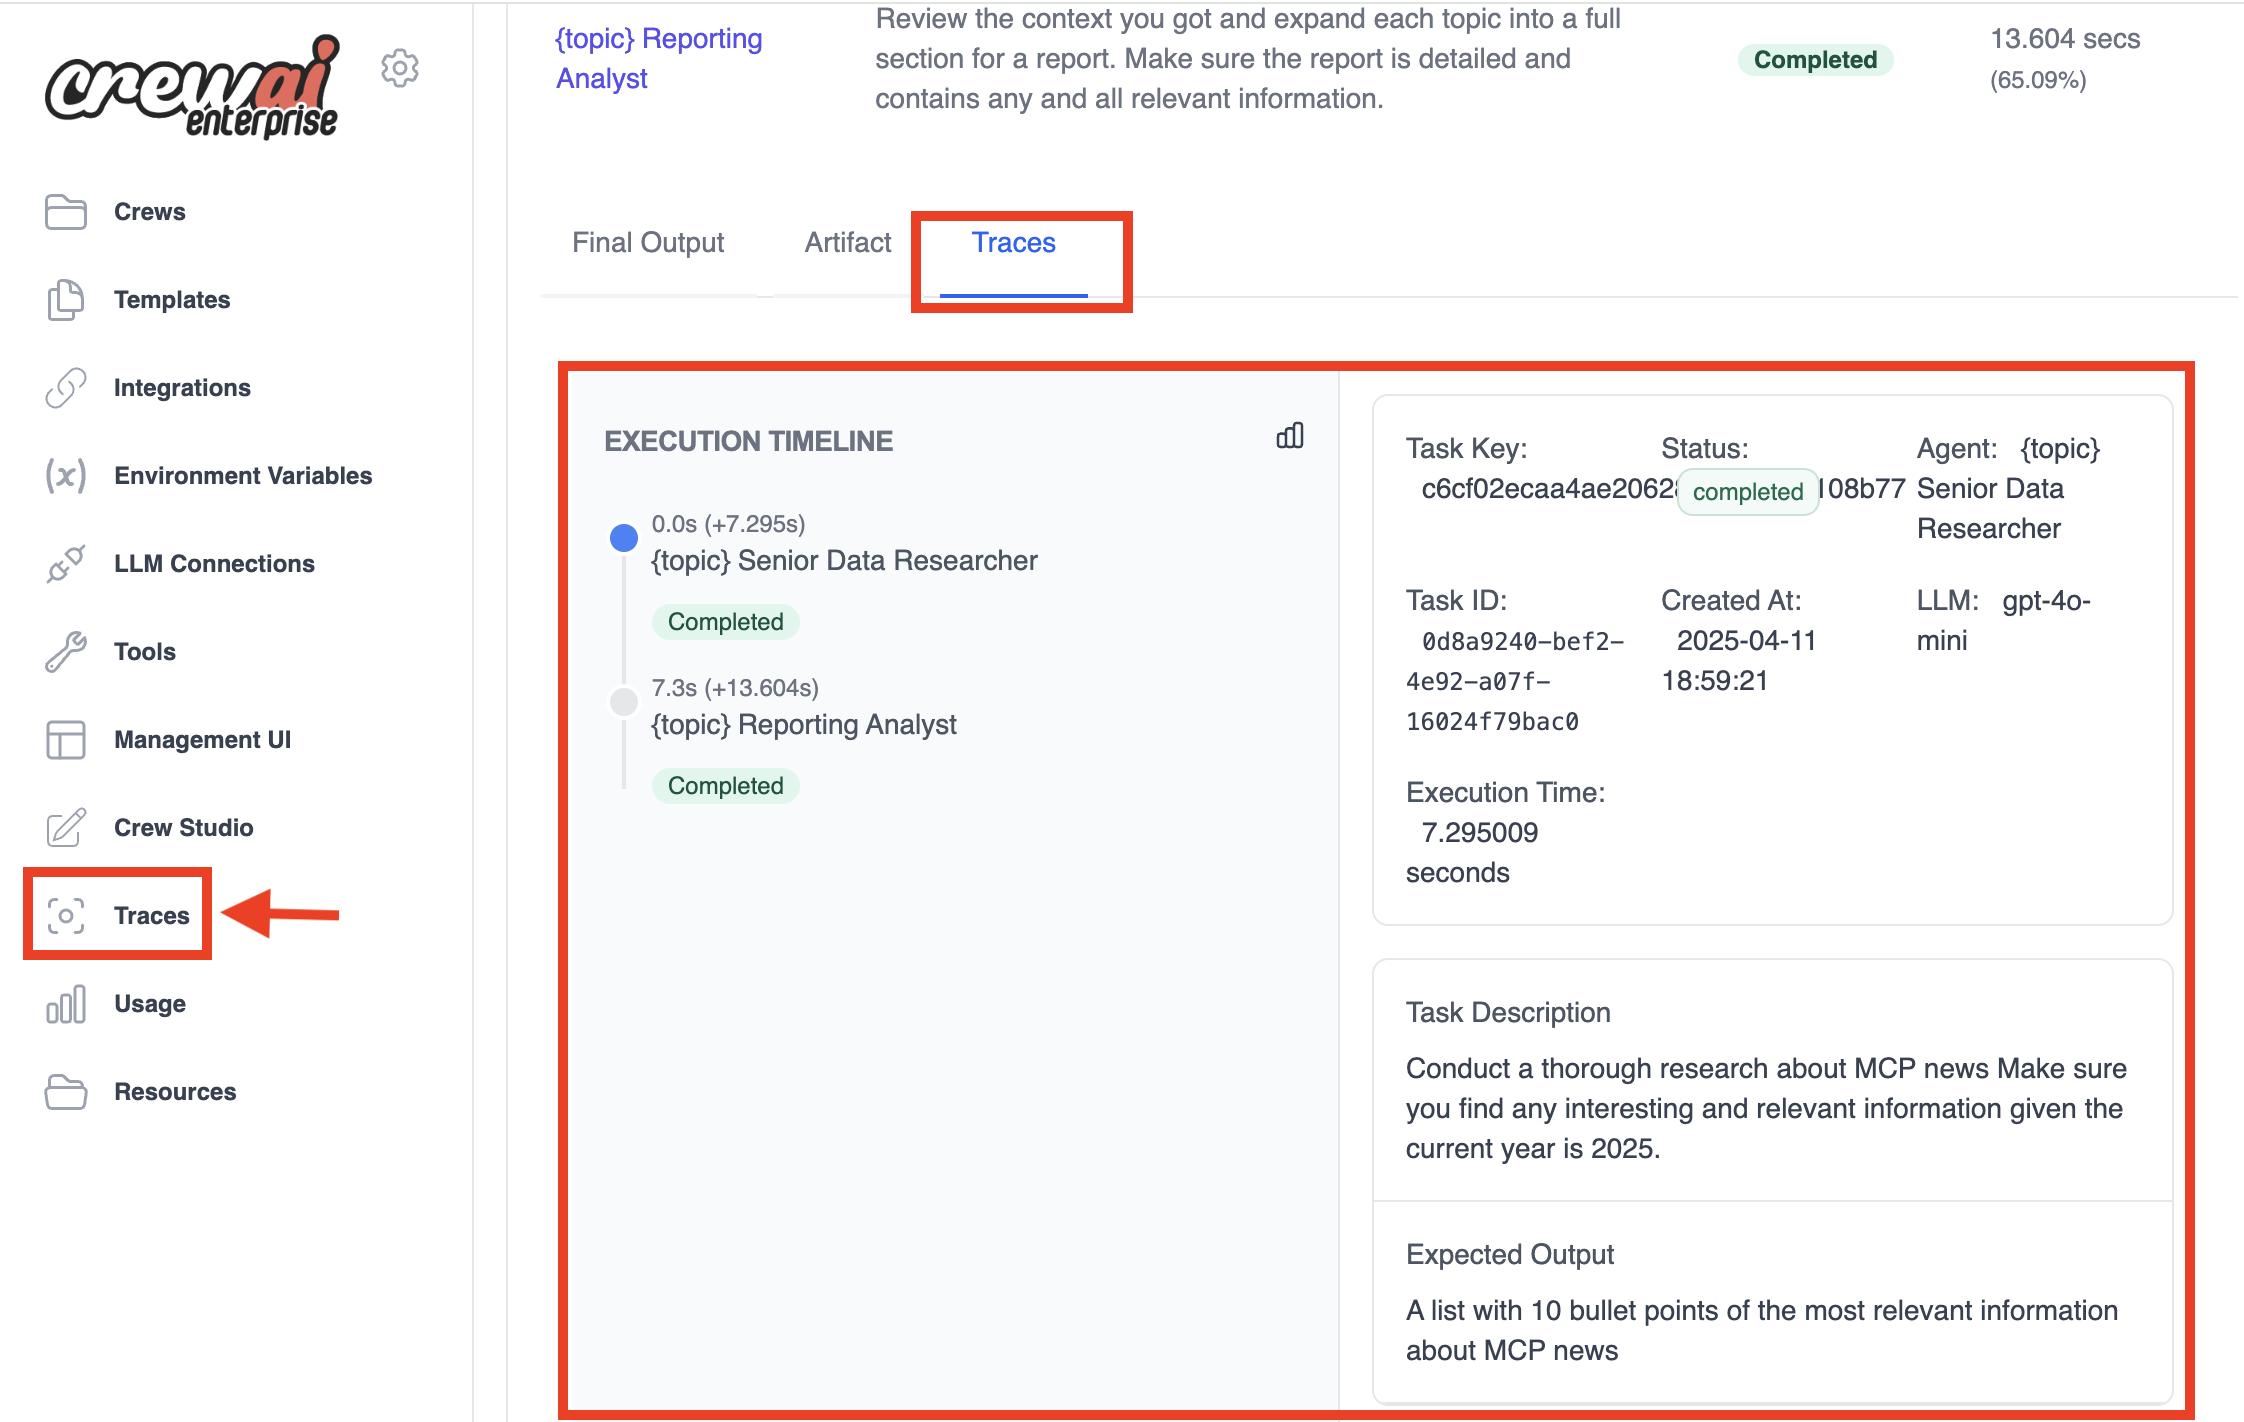
Once in your CrewAI AMP dashboard, click on the **Traces** to view all execution records.
You'll see a list of all crew executions, sorted by date. Click on any execution to view its detailed trace.
## Understanding the Trace Interface
The trace interface is divided into several sections, each providing different insights into your crew's execution:
### 1. Execution Summary
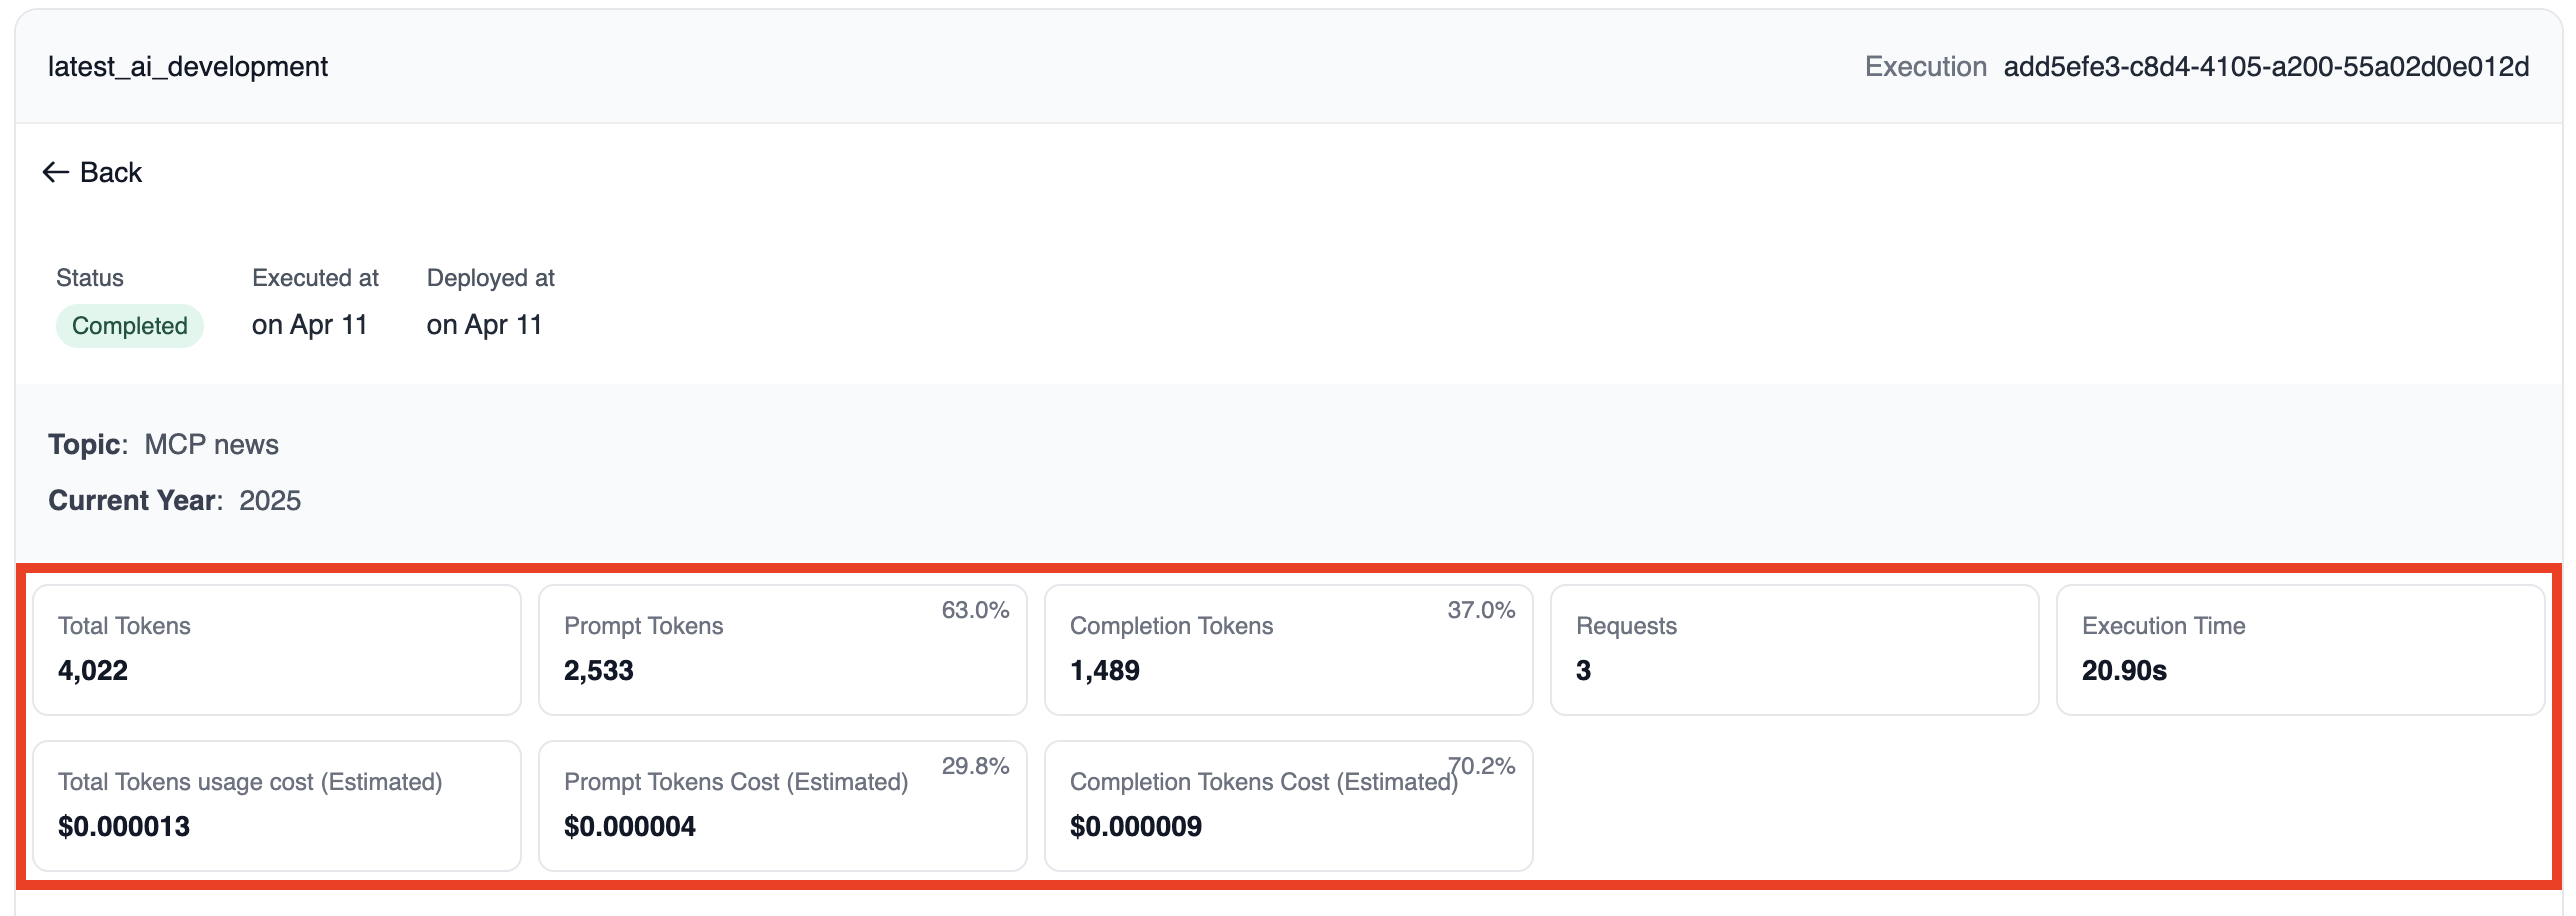
The top section displays high-level metrics about the execution:
* **Total Tokens**: Number of tokens consumed across all tasks
* **Prompt Tokens**: Tokens used in prompts to the LLM
* **Completion Tokens**: Tokens generated in LLM responses
* **Requests**: Number of API calls made
* **Execution Time**: Total duration of the crew run
* **Estimated Cost**: Approximate cost based on token usage
## Accessing Traces
Once in your CrewAI AMP dashboard, click on the **Traces** to view all execution records.
You'll see a list of all crew executions, sorted by date. Click on any execution to view its detailed trace.
## Understanding the Trace Interface
The trace interface is divided into several sections, each providing different insights into your crew's execution:
### 1. Execution Summary
The top section displays high-level metrics about the execution:
* **Total Tokens**: Number of tokens consumed across all tasks
* **Prompt Tokens**: Tokens used in prompts to the LLM
* **Completion Tokens**: Tokens generated in LLM responses
* **Requests**: Number of API calls made
* **Execution Time**: Total duration of the crew run
* **Estimated Cost**: Approximate cost based on token usage
 ### 2. Tasks & Agents
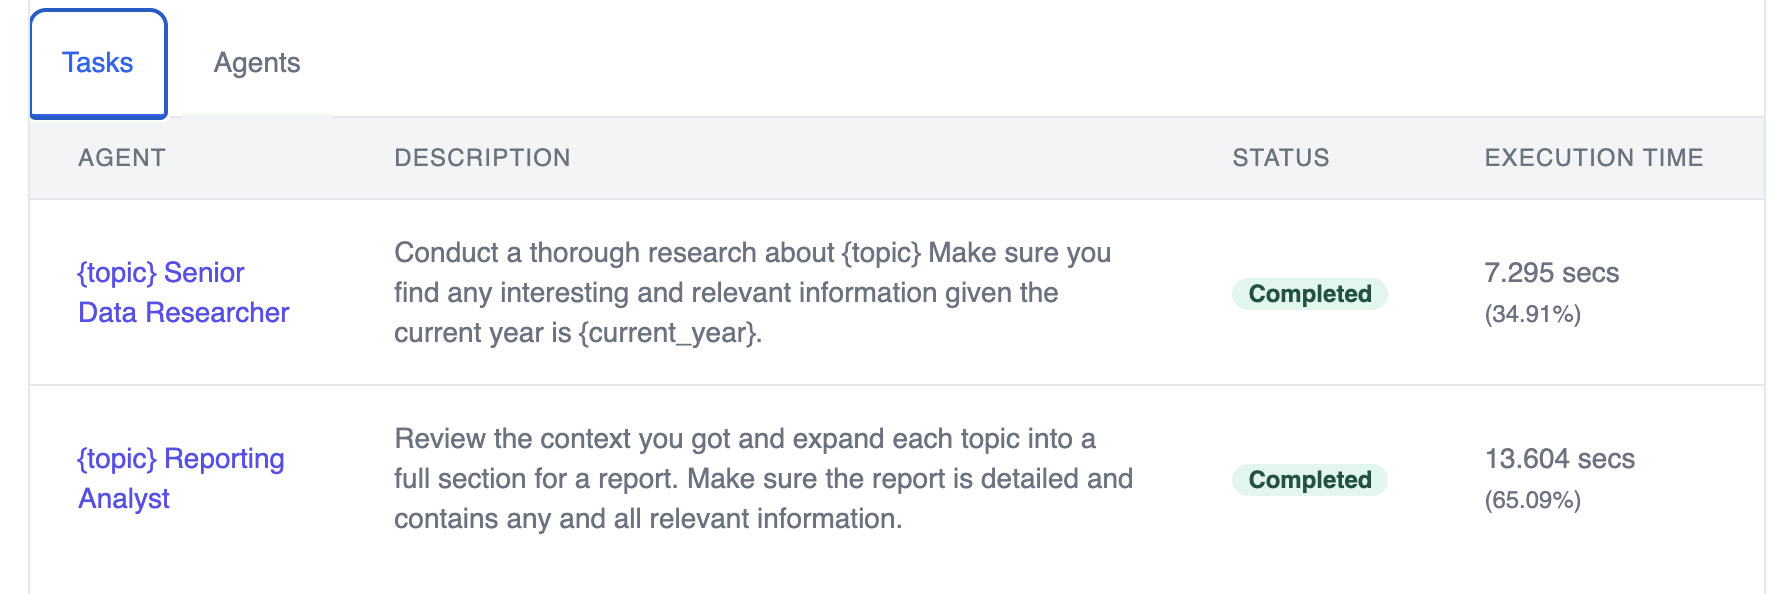
This section shows all tasks and agents that were part of the crew execution:
* Task name and agent assignment
* Agents and LLMs used for each task
* Status (completed/failed)
* Individual execution time of the task
### 2. Tasks & Agents
This section shows all tasks and agents that were part of the crew execution:
* Task name and agent assignment
* Agents and LLMs used for each task
* Status (completed/failed)
* Individual execution time of the task
 ### 3. Final Output
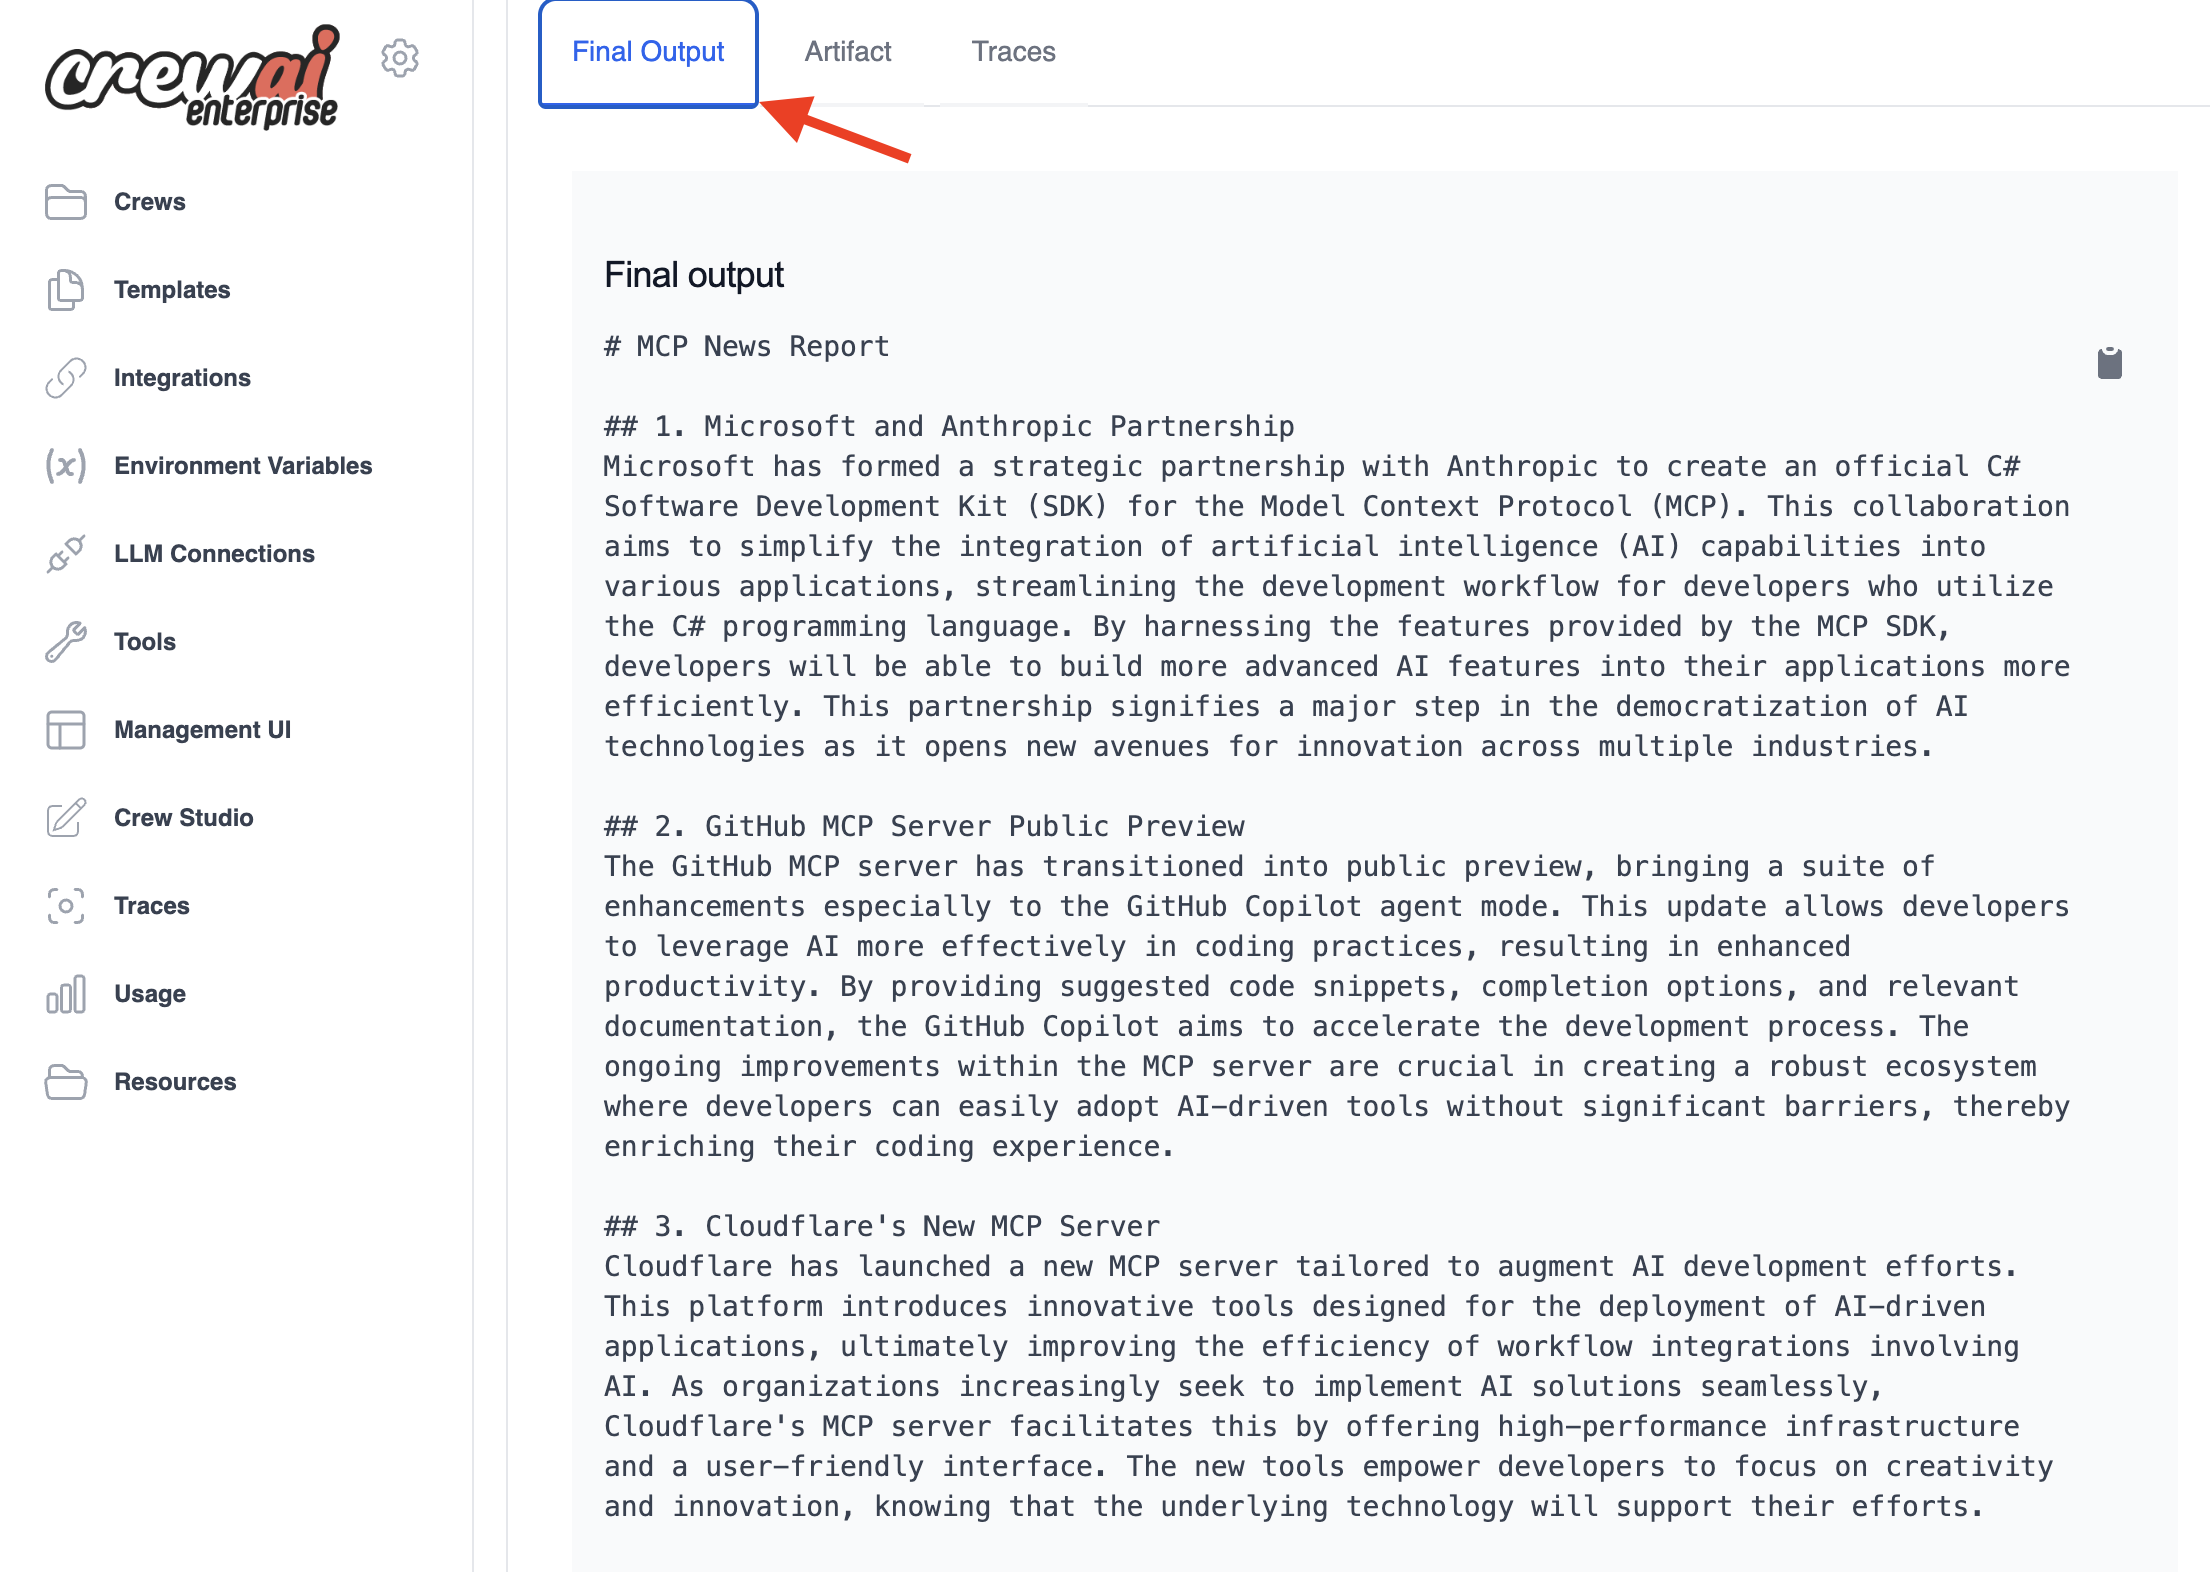
Displays the final result produced by the crew after all tasks are completed.
### 3. Final Output
Displays the final result produced by the crew after all tasks are completed.
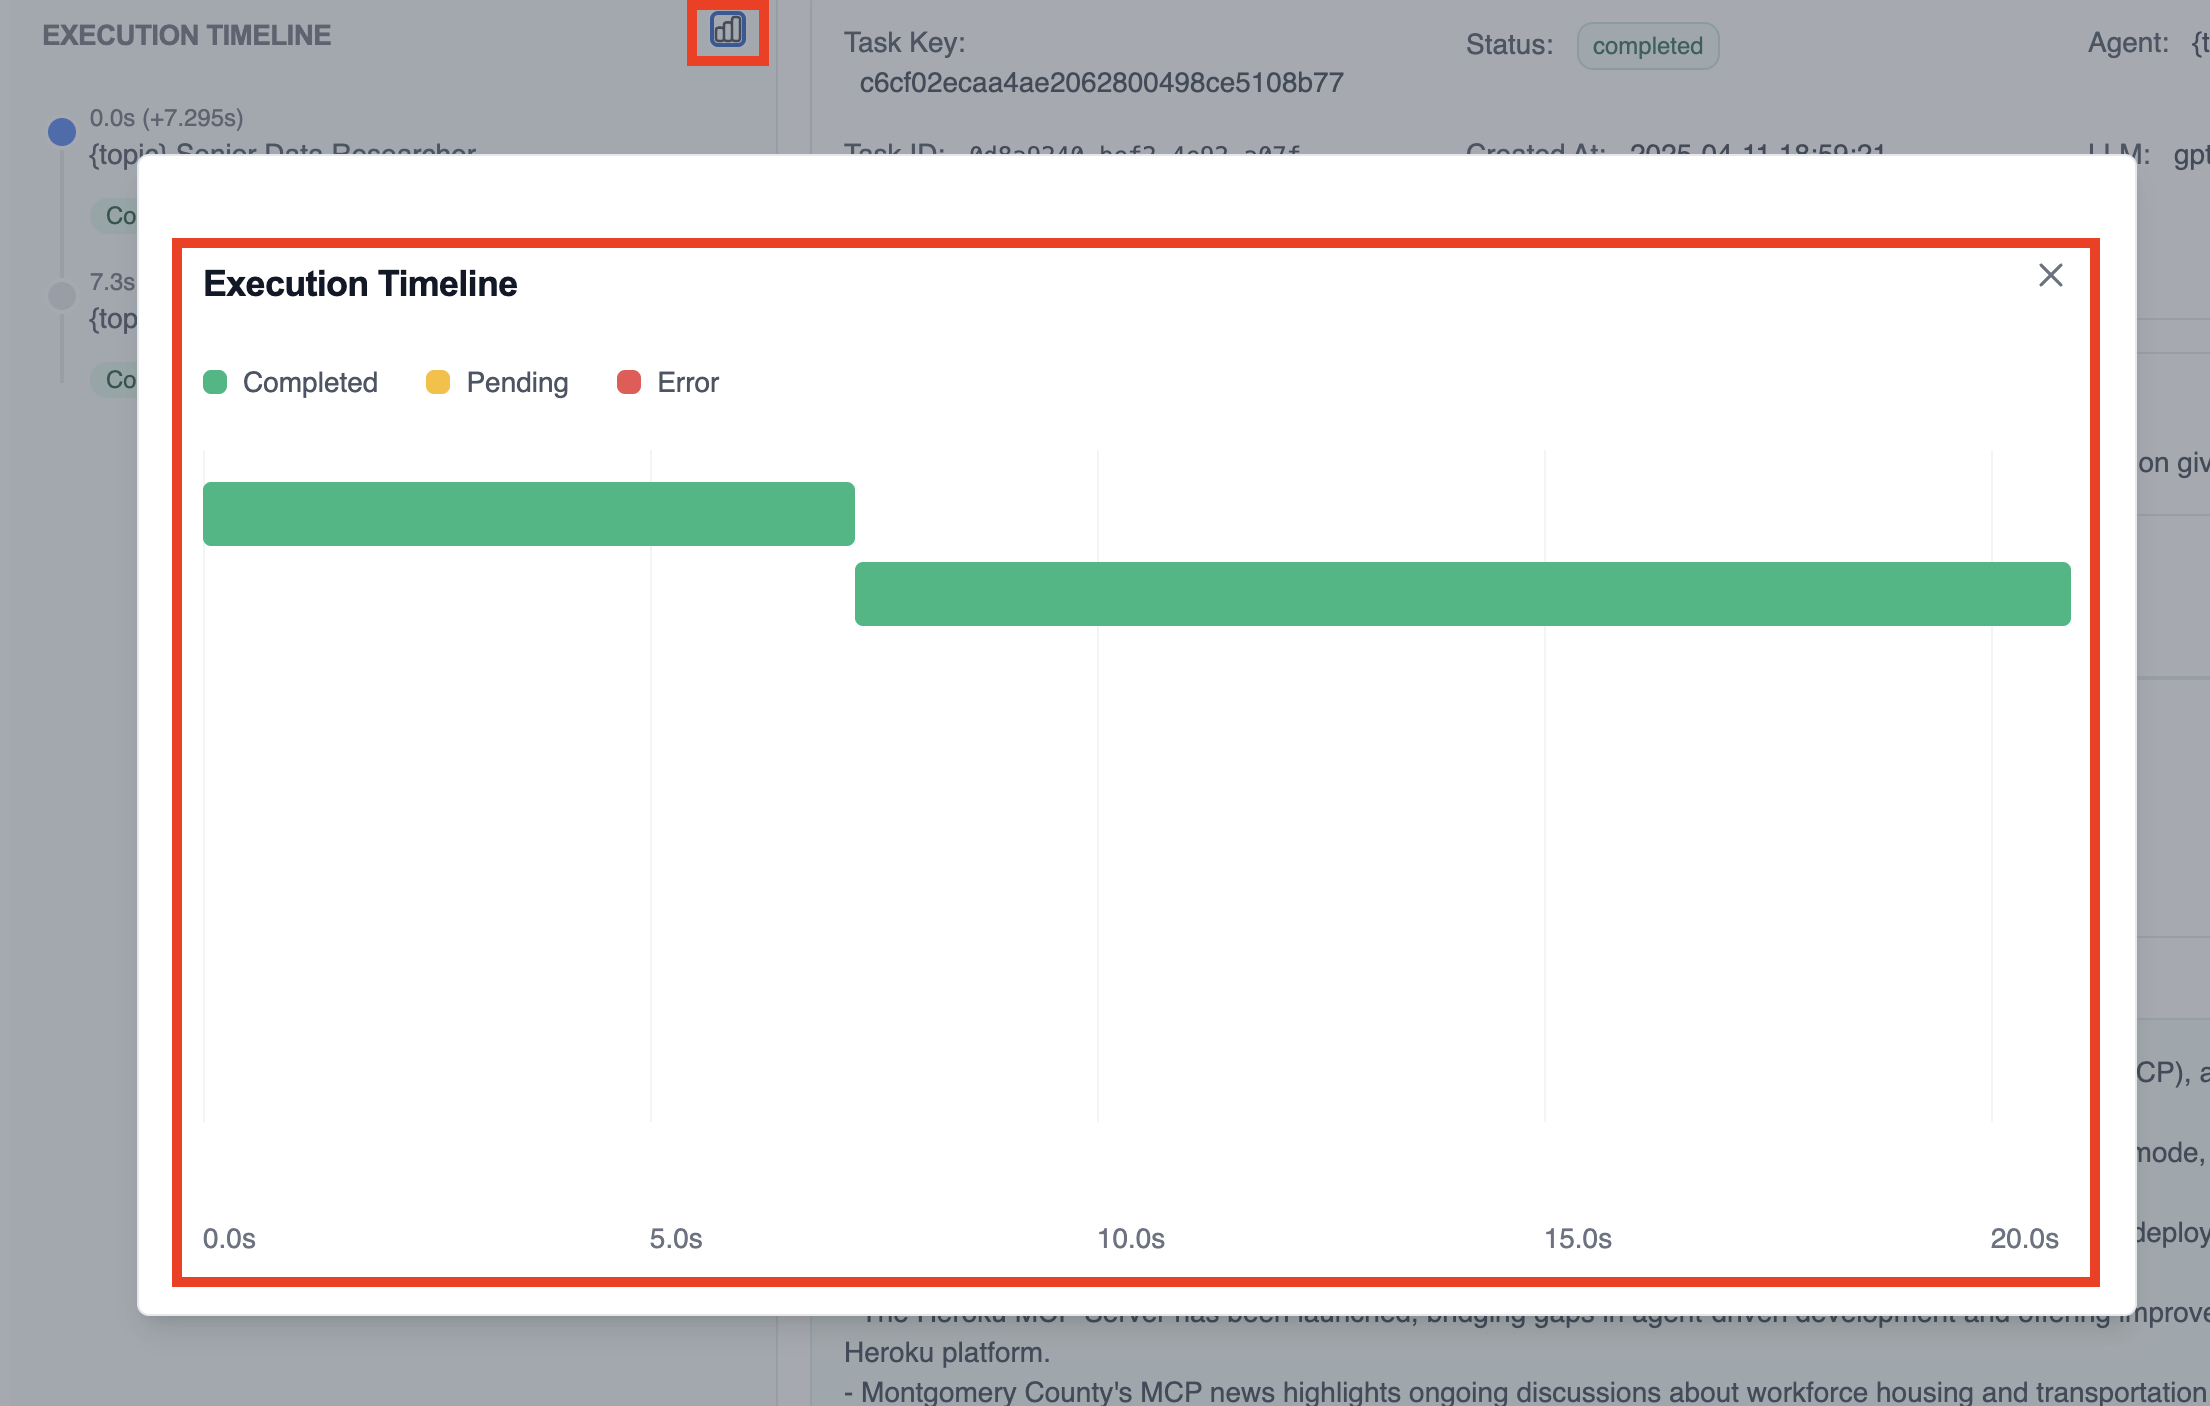
 ### 4. Execution Timeline
A visual representation of when each task started and ended, helping you identify bottlenecks or parallel execution patterns.
### 4. Execution Timeline
A visual representation of when each task started and ended, helping you identify bottlenecks or parallel execution patterns.
 ### 5. Detailed Task View
When you click on a specific task in the timeline or task list, you'll see:
### 5. Detailed Task View
When you click on a specific task in the timeline or task list, you'll see:
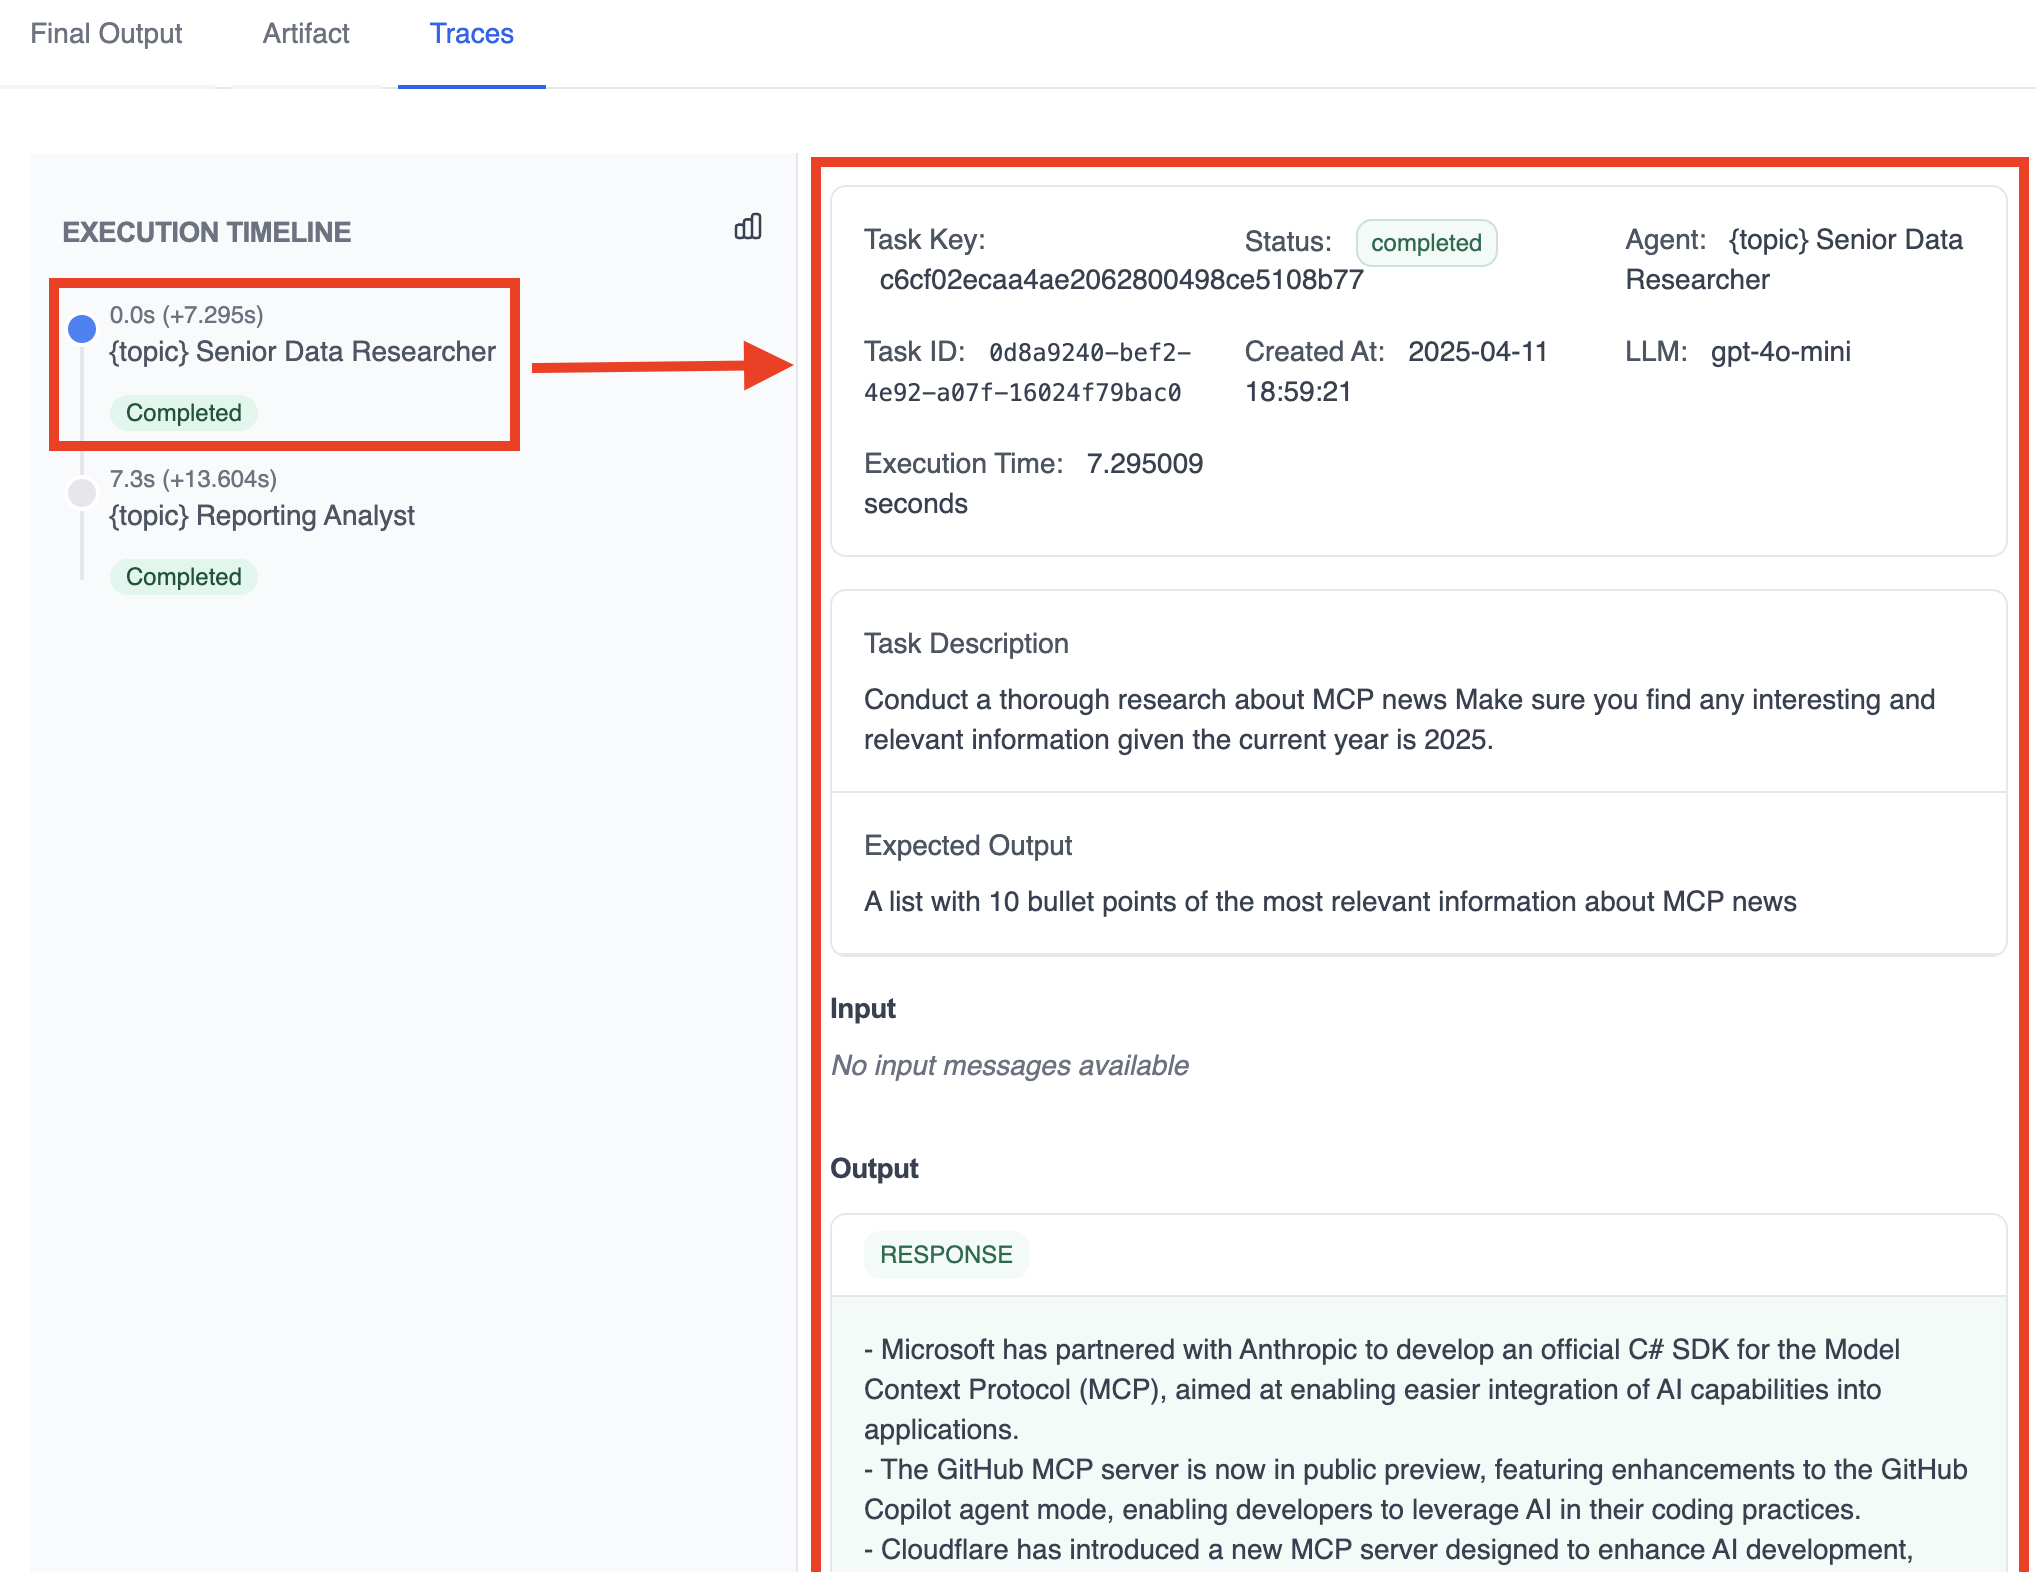 * **Task Key**: Unique identifier for the task
* **Task ID**: Technical identifier in the system
* **Status**: Current state (completed/running/failed)
* **Agent**: Which agent performed the task
* **LLM**: Language model used for this task
* **Start/End Time**: When the task began and completed
* **Execution Time**: Duration of this specific task
* **Task Description**: What the agent was instructed to do
* **Expected Output**: What output format was requested
* **Input**: Any input provided to this task from previous tasks
* **Output**: The actual result produced by the agent
## Using Traces for Debugging
Traces are invaluable for troubleshooting issues with your crews:
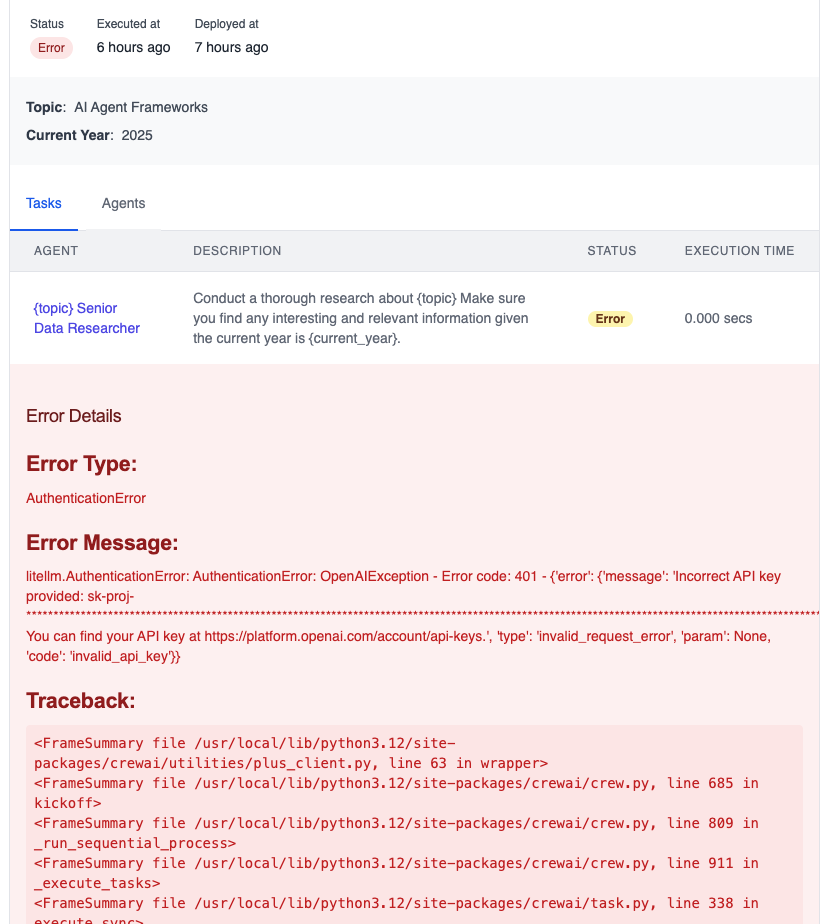
When a crew execution doesn't produce the expected results, examine the trace to find where things went wrong. Look for:
* Failed tasks
* Unexpected agent decisions
* Tool usage errors
* Misinterpreted instructions
* **Task Key**: Unique identifier for the task
* **Task ID**: Technical identifier in the system
* **Status**: Current state (completed/running/failed)
* **Agent**: Which agent performed the task
* **LLM**: Language model used for this task
* **Start/End Time**: When the task began and completed
* **Execution Time**: Duration of this specific task
* **Task Description**: What the agent was instructed to do
* **Expected Output**: What output format was requested
* **Input**: Any input provided to this task from previous tasks
* **Output**: The actual result produced by the agent
## Using Traces for Debugging
Traces are invaluable for troubleshooting issues with your crews:
When a crew execution doesn't produce the expected results, examine the trace to find where things went wrong. Look for:
* Failed tasks
* Unexpected agent decisions
* Tool usage errors
* Misinterpreted instructions
 Use execution metrics to identify performance bottlenecks:
* Tasks that took longer than expected
* Excessive token usage
* Redundant tool operations
* Unnecessary API calls
Analyze token usage and cost estimates to optimize your crew's efficiency:
* Consider using smaller models for simpler tasks
* Refine prompts to be more concise
* Cache frequently accessed information
* Structure tasks to minimize redundant operations
## Performance and batching
CrewAI batches trace uploads to reduce overhead on high-volume runs:
* A TraceBatchManager buffers events and sends them in batches via the Plus API client
* Reduces network chatter and improves reliability on flaky connections
* Automatically enabled in the default trace listener; no configuration needed
This yields more stable tracing under load while preserving detailed task/agent telemetry.
Contact our support team for assistance with trace analysis or any other
CrewAI AMP features.
Use execution metrics to identify performance bottlenecks:
* Tasks that took longer than expected
* Excessive token usage
* Redundant tool operations
* Unnecessary API calls
Analyze token usage and cost estimates to optimize your crew's efficiency:
* Consider using smaller models for simpler tasks
* Refine prompts to be more concise
* Cache frequently accessed information
* Structure tasks to minimize redundant operations
## Performance and batching
CrewAI batches trace uploads to reduce overhead on high-volume runs:
* A TraceBatchManager buffers events and sends them in batches via the Plus API client
* Reduces network chatter and improves reliability on flaky connections
* Automatically enabled in the default trace listener; no configuration needed
This yields more stable tracing under load while preserving detailed task/agent telemetry.
Contact our support team for assistance with trace analysis or any other
CrewAI AMP features.