> ## Documentation Index
> Fetch the complete documentation index at: https://docs.crewai.com/llms.txt
> Use this file to discover all available pages before exploring further.
# OpenTelemetry Export
> Export traces and logs from your CrewAI AMP deployments to your own OpenTelemetry collector
CrewAI AMP can export OpenTelemetry **traces** and **logs** from your deployments directly to your own collector. This lets you monitor agent performance, track LLM calls, and debug issues using your existing observability stack.
Telemetry data follows the [OpenTelemetry GenAI semantic conventions](https://opentelemetry.io/docs/specs/semconv/gen-ai/) plus additional CrewAI-specific attributes.
OpenTelemetry is the **recommended observability path** — vendor-neutral, works with any OTLP-compatible backend (Grafana, Honeycomb, NewRelic, your own collector). If you specifically use Datadog, see the dedicated [Datadog Integration](./datadog) guide which covers both the Datadog Agent path and Datadog's OTLP intake.
## Prerequisites
Your organization must have an active CrewAI AMP account.
You need an OpenTelemetry-compatible collector endpoint (e.g., your own OTel Collector, Datadog, Grafana, or any OTLP-compatible backend).
## Setting up a collector
1. In CrewAI AMP, go to **Settings** > **OpenTelemetry Collectors**.
2. Click **Add Collector**.
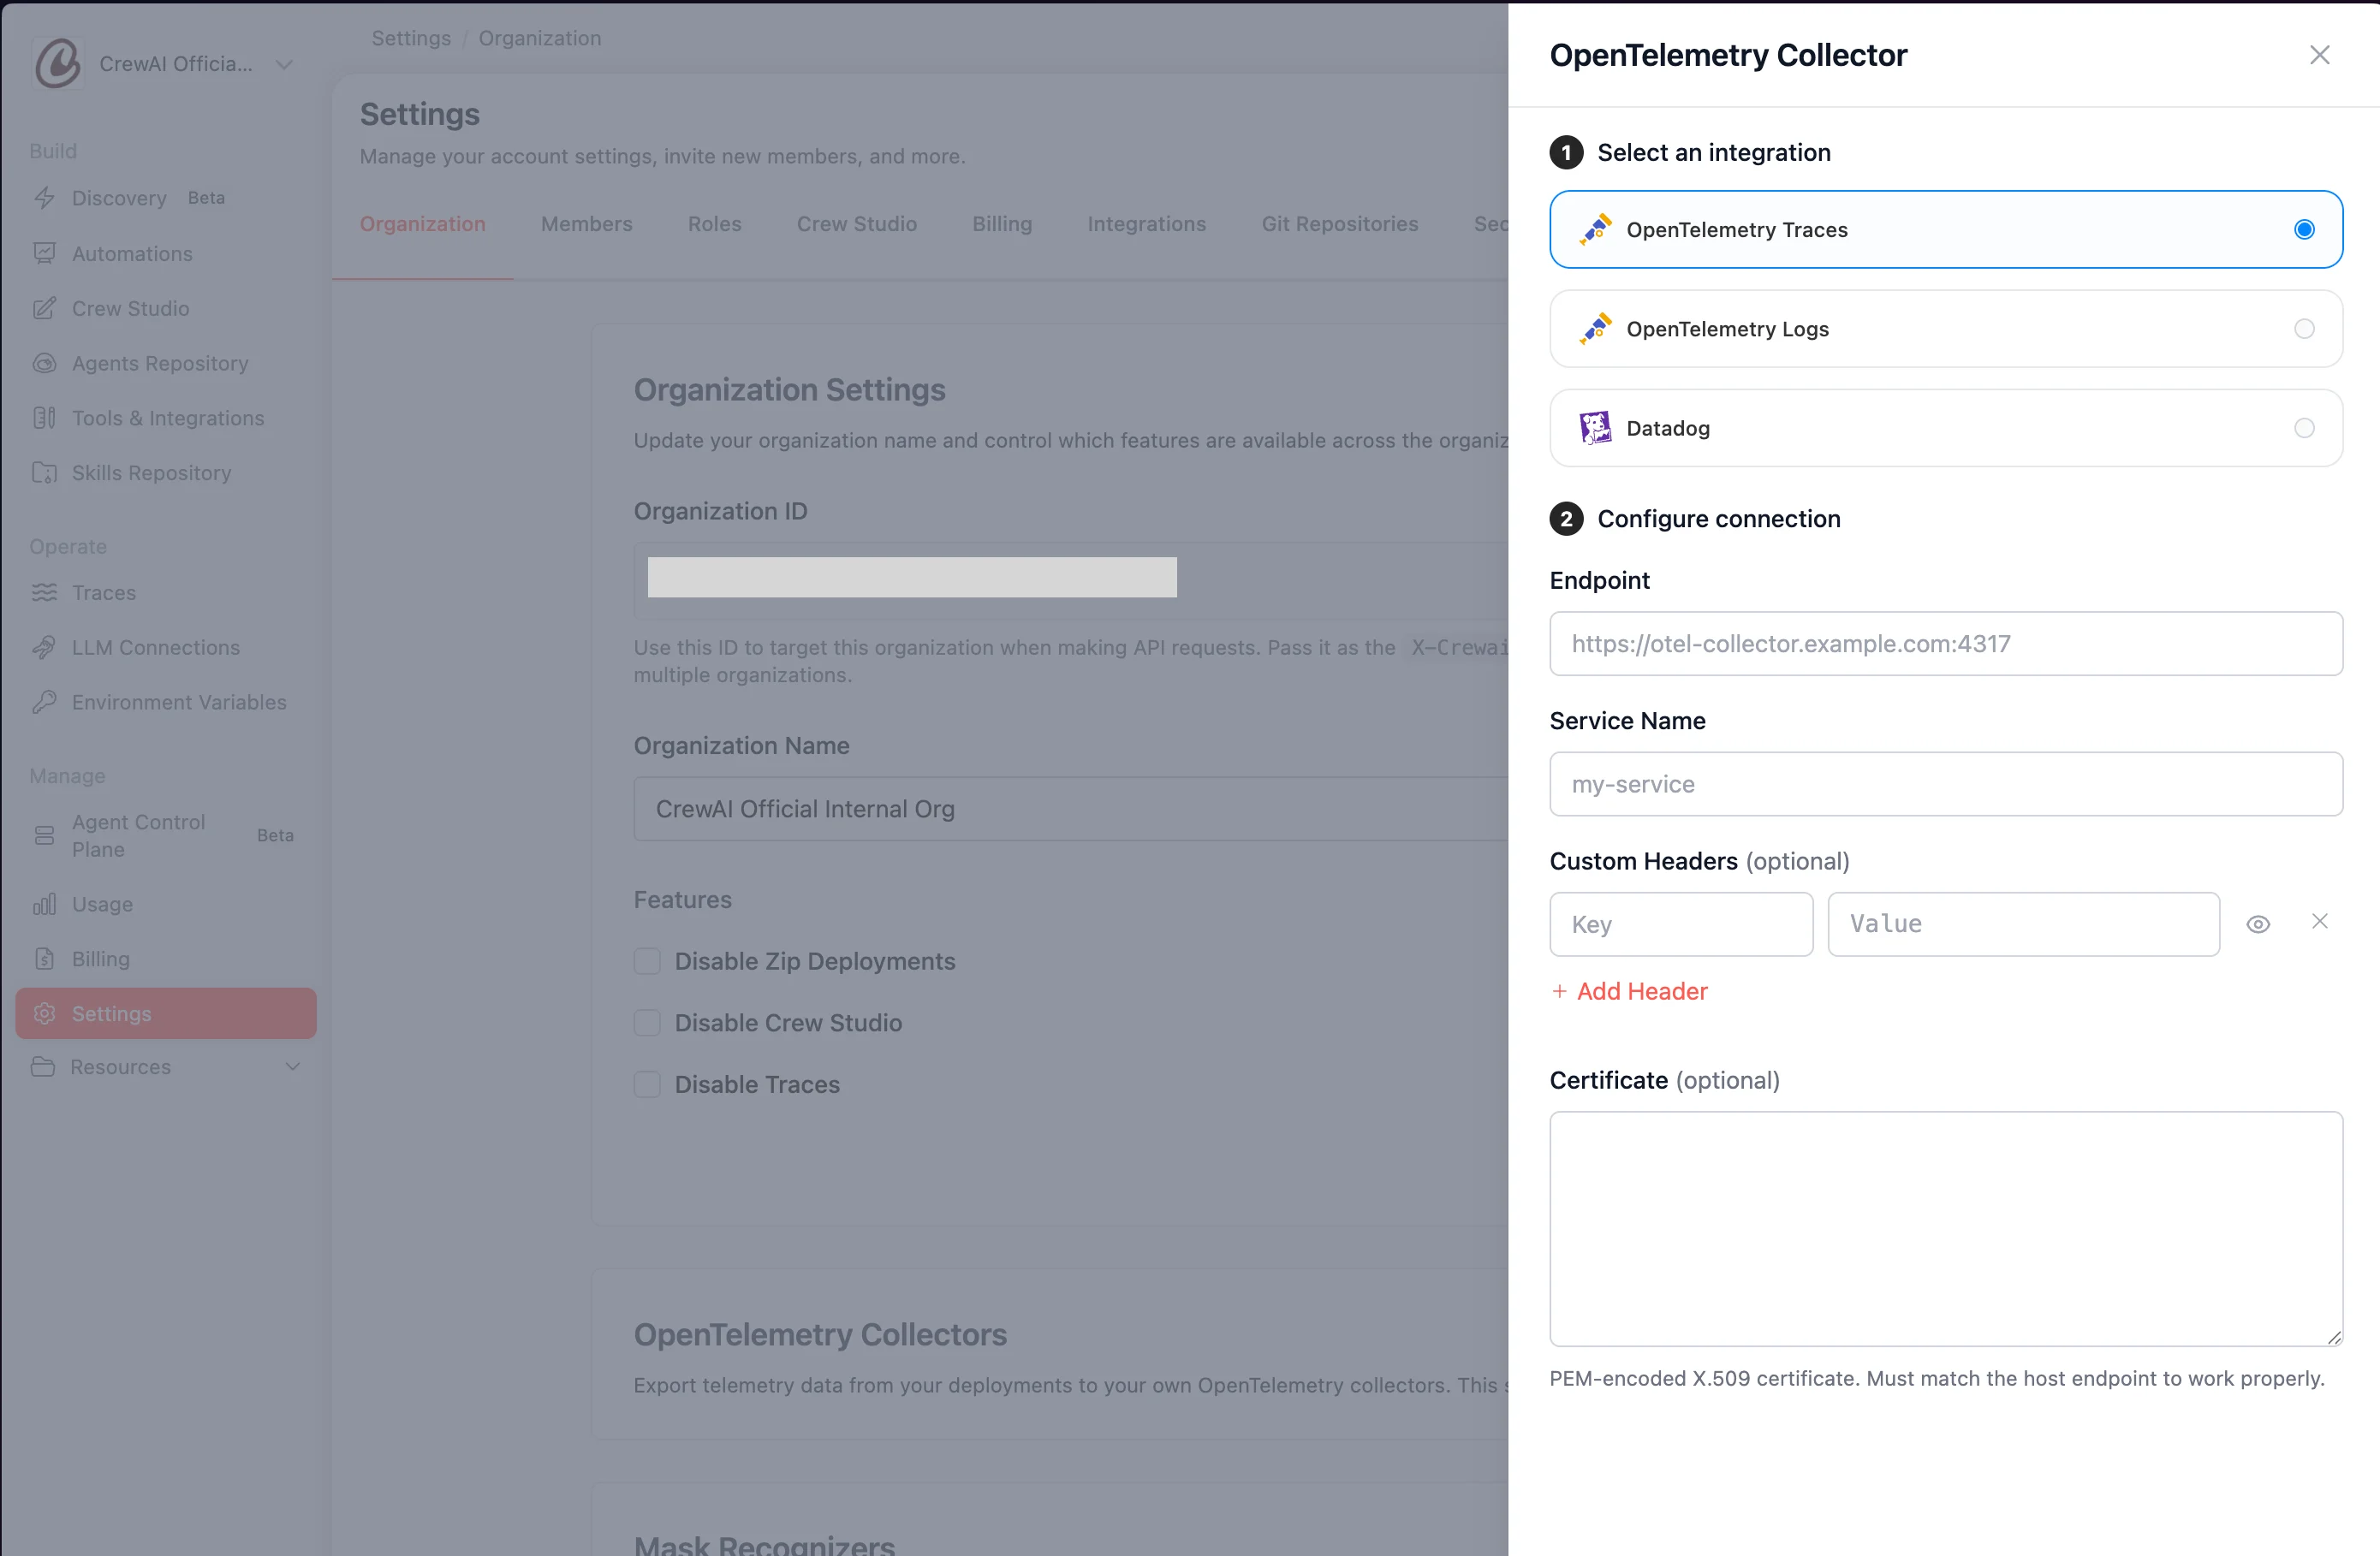
3. Select an integration:
* **OpenTelemetry Traces** and **OpenTelemetry Logs** — export to any OTLP-compatible collector or backend.
* **Datadog** — send traces straight to Datadog's OTLP intake, no separate collector or Datadog Agent required.
4. Configure the connection. The fields depend on the integration you selected:
**OpenTelemetry Traces** and **OpenTelemetry Logs** are separate integrations that share the same fields — pick the one matching the signal you want to export.
* **Endpoint** — Your collector's OTLP endpoint (e.g., `https://otel-collector.example.com:4317`).
* **Service Name** — A name to identify this service in your observability platform.
* **Custom Headers** *(optional)* — Add authentication or routing headers as key-value pairs.
* **Certificate** *(optional)* — Provide a TLS certificate if your collector requires one.
 For Datadog setup, see the dedicated [Datadog Integration](./datadog) guide — it covers both the Datadog Agent path (recommended, cheaper for log volume) and Datadog's OTLP intake with full collector configuration steps.
5. *(optional)* Click **Test Connection** to verify CrewAI can reach the endpoint with the credentials you provided.
6. Click **Save**.
You can add multiple collectors — for example, one for traces and another for logs, or send to different backends for different purposes.
For Datadog setup, see the dedicated [Datadog Integration](./datadog) guide — it covers both the Datadog Agent path (recommended, cheaper for log volume) and Datadog's OTLP intake with full collector configuration steps.
5. *(optional)* Click **Test Connection** to verify CrewAI can reach the endpoint with the credentials you provided.
6. Click **Save**.
You can add multiple collectors — for example, one for traces and another for logs, or send to different backends for different purposes.