> ## Documentation Index
> Fetch the complete documentation index at: https://docs.crewai.com/llms.txt
> Use this file to discover all available pages before exploring further.
# Watch your Automations
> Watch fleet health, LLM consumption, and per-automation behavior from the Automations tab.
**ACP (Beta) Docs Navigation**
* [Overview](/en/enterprise/features/agent-control-plane/overview)
* **Monitoring** *(you are here)*
* [Policies](/edge/en/enterprise/features/agent-control-plane/policies)
## Overview
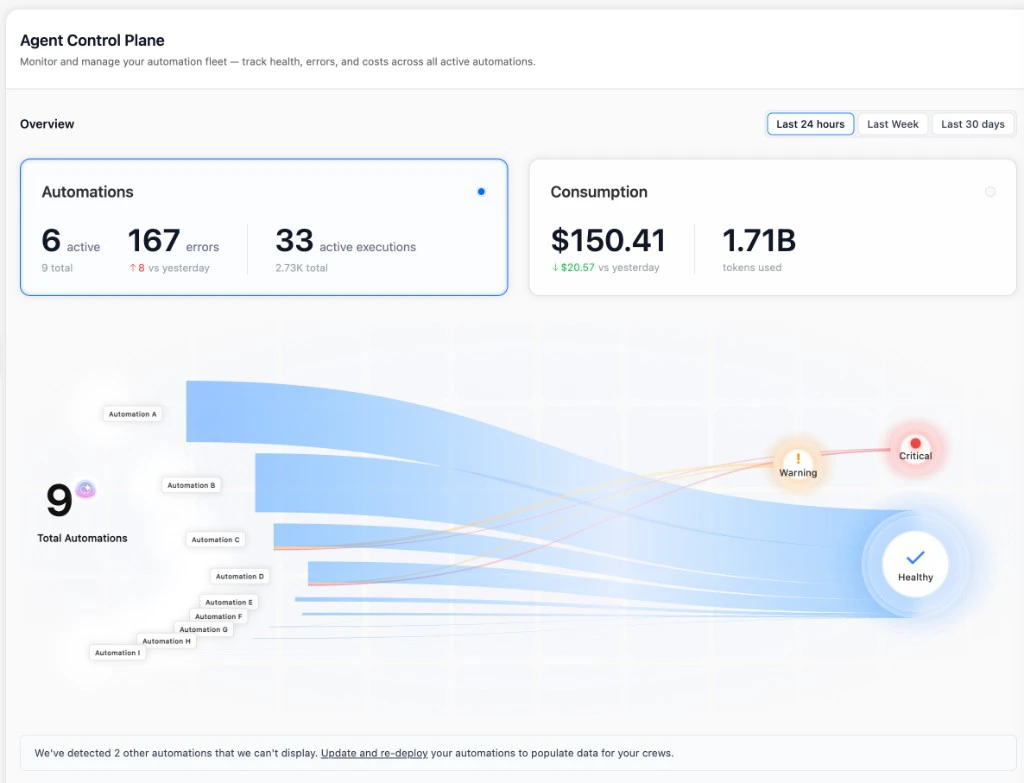
The **Automations** tab is the read-only operations view of the [Agent Control Plane](/en/enterprise/features/agent-control-plane/overview). It combines two metric cards, an interactive sankey, and two sub-tables — **Automations** and **Consumption** — that you can search, filter, and sort.
 All charts and tables respect the **Last 24 hours / Last Week / Last 30 days** selector at the top right. Deltas compare the selected window against the previous one of the same length.
Rows only show data for deployments on **crewAI v1.13 or higher** — older deployments appear in the *"We've detected N other automations that we can't display"* banner under the sankey and contribute zero metrics until they're updated and re-deployed. See [Overview — Requirements](/en/enterprise/features/agent-control-plane/overview#requirements).
## Dashboard
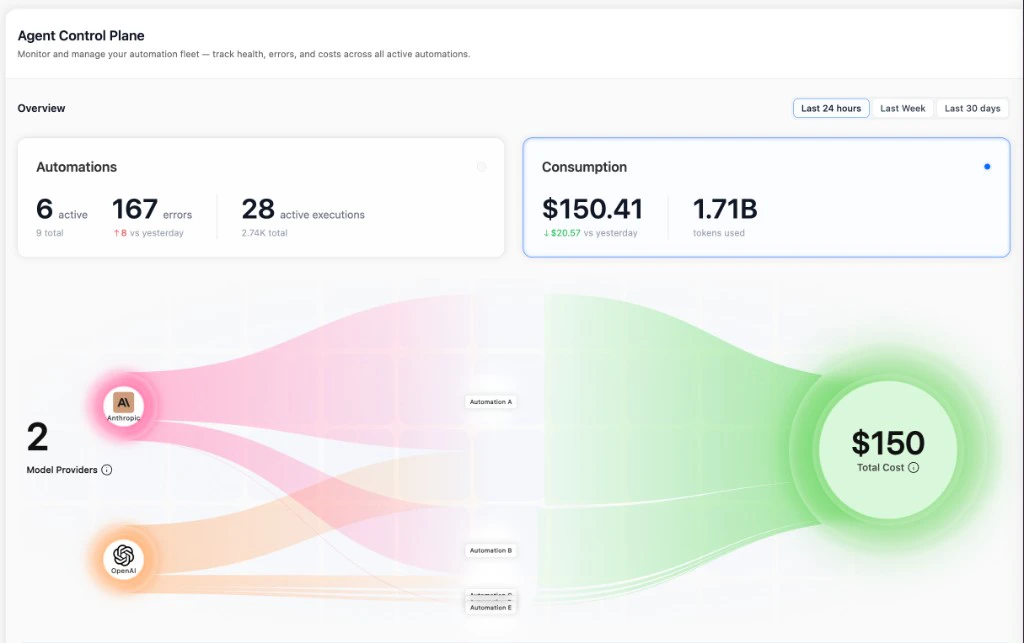
The header of the page has two metric cards and an interactive sankey. Clicking either card switches the sankey between two modes:
* **Health mode** — `Total Automations → status buckets (Critical / Warning / Healthy)`. Click a bucket to filter the Automations table to just those deployments.
* **Consumption mode** — `Model Providers → Automations → Total Cost`. Click a provider to filter the Consumption table to that provider.
| Card | What it shows |
| --------------- | ------------------------------------------------------------------------------------------------------------------------------------------------------------------- |
| **Automations** | `active` automations (and total count), total `errors` in the window, currently `active executions` (and total in the window), with a delta vs the previous period. |
| **Consumption** | Total `cost` and `tokens used`, with a cost delta vs the previous period. |
All charts and tables respect the **Last 24 hours / Last Week / Last 30 days** selector at the top right. Deltas compare the selected window against the previous one of the same length.
Rows only show data for deployments on **crewAI v1.13 or higher** — older deployments appear in the *"We've detected N other automations that we can't display"* banner under the sankey and contribute zero metrics until they're updated and re-deployed. See [Overview — Requirements](/en/enterprise/features/agent-control-plane/overview#requirements).
## Dashboard
The header of the page has two metric cards and an interactive sankey. Clicking either card switches the sankey between two modes:
* **Health mode** — `Total Automations → status buckets (Critical / Warning / Healthy)`. Click a bucket to filter the Automations table to just those deployments.
* **Consumption mode** — `Model Providers → Automations → Total Cost`. Click a provider to filter the Consumption table to that provider.
| Card | What it shows |
| --------------- | ------------------------------------------------------------------------------------------------------------------------------------------------------------------- |
| **Automations** | `active` automations (and total count), total `errors` in the window, currently `active executions` (and total in the window), with a delta vs the previous period. |
| **Consumption** | Total `cost` and `tokens used`, with a cost delta vs the previous period. |
 ## Automations table
The **Automations** sub-tab is the per-deployment breakdown of fleet health. Each row is one deployed crew or flow.
## Automations table
The **Automations** sub-tab is the per-deployment breakdown of fleet health. Each row is one deployed crew or flow.
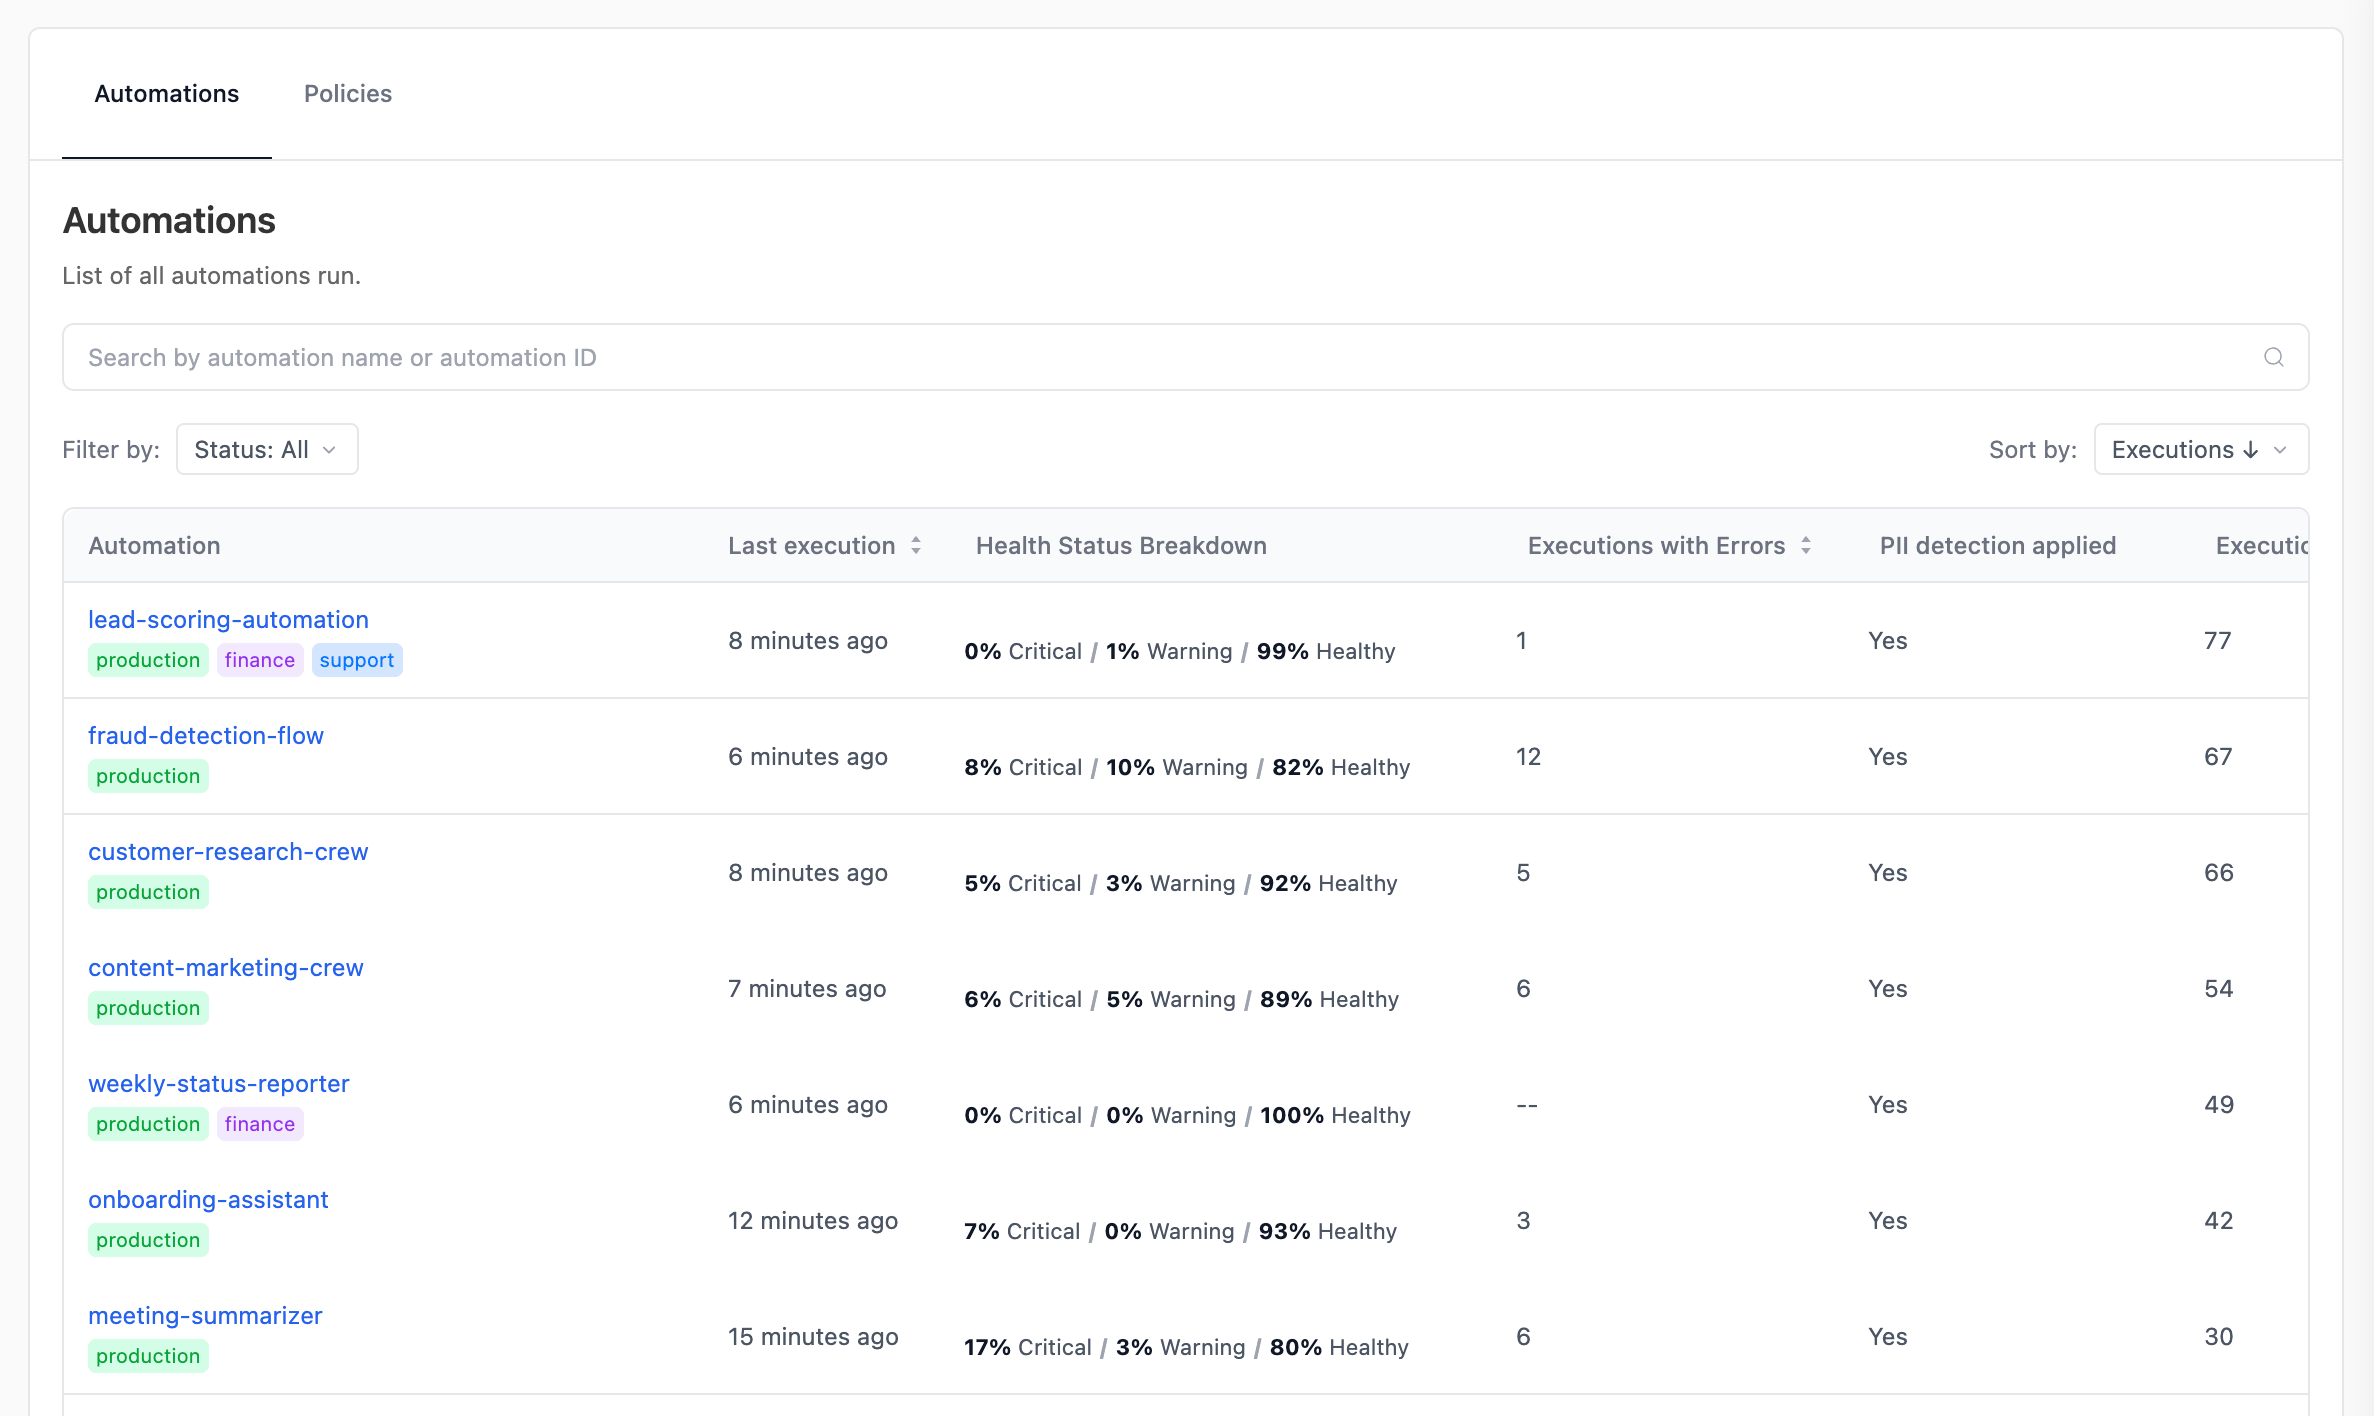 | Column | What it shows |
| --------------------------- | ------------------------------------------------------------------------------------------------------------------------------------- |
| **Automation** | Deployment name and any tags assigned to it (e.g. `production`, `financial`). |
| **Last execution** | Time since the most recent run. |
| **Health Status Breakdown** | Stacked bar of `Critical` / `Warning` / `Healthy` percentages for executions in the window. |
| **Executions with Errors** | Total failed executions in the window. |
| **PII detection applied** | `Yes` if a per-deployment PII config or a matching [PII policy](/edge/en/enterprise/features/agent-control-plane/policies) is active. |
| **Executions** | Total executions in the window. |
| **Last updated** | When the deployment was last re-deployed. |
| **Crew Version** | The `crewai` version reported by the deployment. An info icon next to versions below `1.13` flags rows that can't contribute metrics. |
Search by name, filter by `Status` (`Healthy` / `Warning` / `Critical`), and sort by any column header. Click a deployment name to open the **Automation panel** (see below).
## Consumption table
The **Consumption** sub-tab is the per-deployment breakdown of LLM spend and token usage.
| Column | What it shows |
| --------------------------- | ------------------------------------------------------------------------------------------------------------------------------------- |
| **Automation** | Deployment name and any tags assigned to it (e.g. `production`, `financial`). |
| **Last execution** | Time since the most recent run. |
| **Health Status Breakdown** | Stacked bar of `Critical` / `Warning` / `Healthy` percentages for executions in the window. |
| **Executions with Errors** | Total failed executions in the window. |
| **PII detection applied** | `Yes` if a per-deployment PII config or a matching [PII policy](/edge/en/enterprise/features/agent-control-plane/policies) is active. |
| **Executions** | Total executions in the window. |
| **Last updated** | When the deployment was last re-deployed. |
| **Crew Version** | The `crewai` version reported by the deployment. An info icon next to versions below `1.13` flags rows that can't contribute metrics. |
Search by name, filter by `Status` (`Healthy` / `Warning` / `Critical`), and sort by any column header. Click a deployment name to open the **Automation panel** (see below).
## Consumption table
The **Consumption** sub-tab is the per-deployment breakdown of LLM spend and token usage.
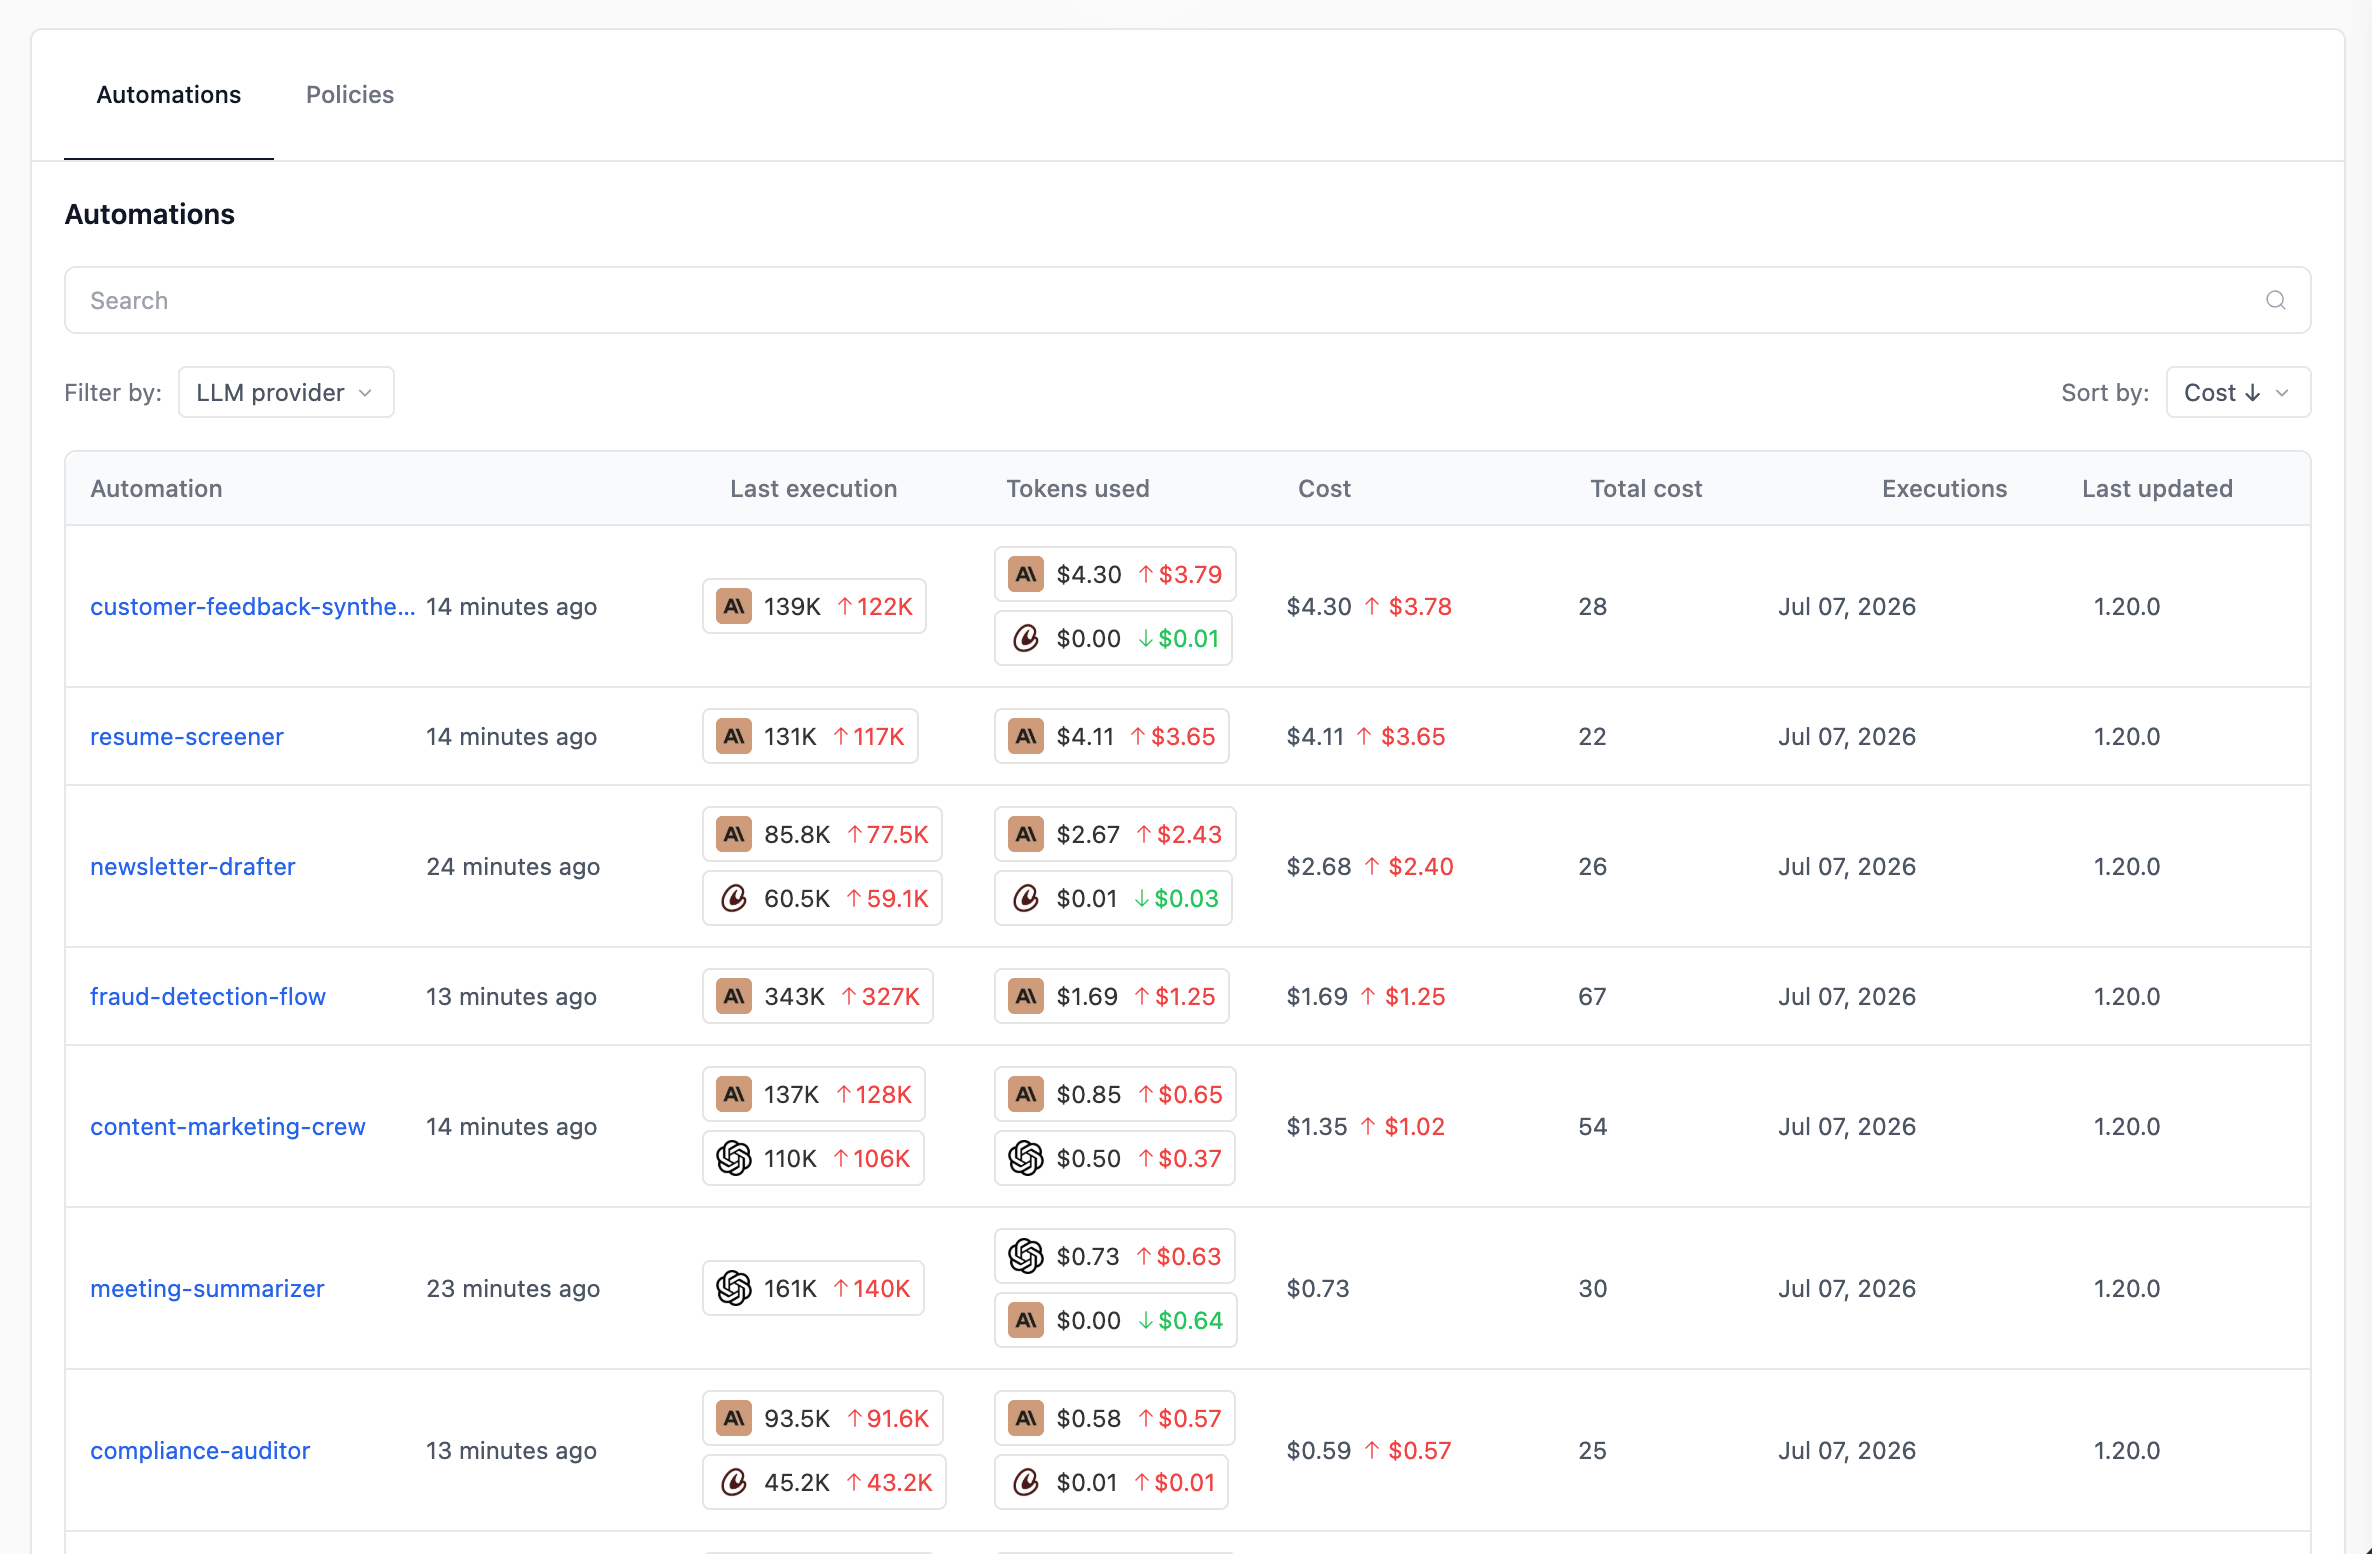 | Column | What it shows |
| ------------------ | ---------------------------------------------------------------------------------------- |
| **Automation** | Deployment name. |
| **Last execution** | Time since the most recent run. |
| **Tokens used** | One row per LLM provider used by this automation, with the delta vs the previous period. |
| **Cost** | Cost per LLM provider, with the delta vs the previous period. |
| **Total cost** | Sum across all providers, with the delta. |
| **Executions** | Total executions in the window. |
| **Last updated** | When the deployment was last re-deployed. |
| **Crew Version** | The `crewai` version reported by the deployment. |
Filter by **LLM provider** and sort by `Cost`, `Executions`, or `Last run`.
**Empty cells (`—` or `$0.00`) usually mean the deployment is below crewAI v1.13.** In the screenshot above, *Automation F* (`1.7.0`) and *Automation I* (`1.12.2`) show blanks for tokens and cost — their executions still run, but they don't emit the provider-level telemetry that powers this table. Update and re-deploy these crews to start collecting consumption data.
## Related
What ACP is, requirements, plan tiers, and RBAC.
Apply organization-wide PII Redaction policies across many automations.
Drill into a single execution to see agent reasoning, tool calls, and token usage.
Deploy a crew on a crewAI version that supports the Agent Control Plane.
Contact our support team for help interpreting metrics in the Agent Control Plane.
| Column | What it shows |
| ------------------ | ---------------------------------------------------------------------------------------- |
| **Automation** | Deployment name. |
| **Last execution** | Time since the most recent run. |
| **Tokens used** | One row per LLM provider used by this automation, with the delta vs the previous period. |
| **Cost** | Cost per LLM provider, with the delta vs the previous period. |
| **Total cost** | Sum across all providers, with the delta. |
| **Executions** | Total executions in the window. |
| **Last updated** | When the deployment was last re-deployed. |
| **Crew Version** | The `crewai` version reported by the deployment. |
Filter by **LLM provider** and sort by `Cost`, `Executions`, or `Last run`.
**Empty cells (`—` or `$0.00`) usually mean the deployment is below crewAI v1.13.** In the screenshot above, *Automation F* (`1.7.0`) and *Automation I* (`1.12.2`) show blanks for tokens and cost — their executions still run, but they don't emit the provider-level telemetry that powers this table. Update and re-deploy these crews to start collecting consumption data.
## Related
What ACP is, requirements, plan tiers, and RBAC.
Apply organization-wide PII Redaction policies across many automations.
Drill into a single execution to see agent reasoning, tool calls, and token usage.
Deploy a crew on a crewAI version that supports the Agent Control Plane.
Contact our support team for help interpreting metrics in the Agent Control Plane.