
Overview
The Automations tab is the read-only operations view of the Agent Control Plane. It combines two metric cards, an interactive sankey, and two sub-tables — Automations and Consumption — that you can search, filter, and sort.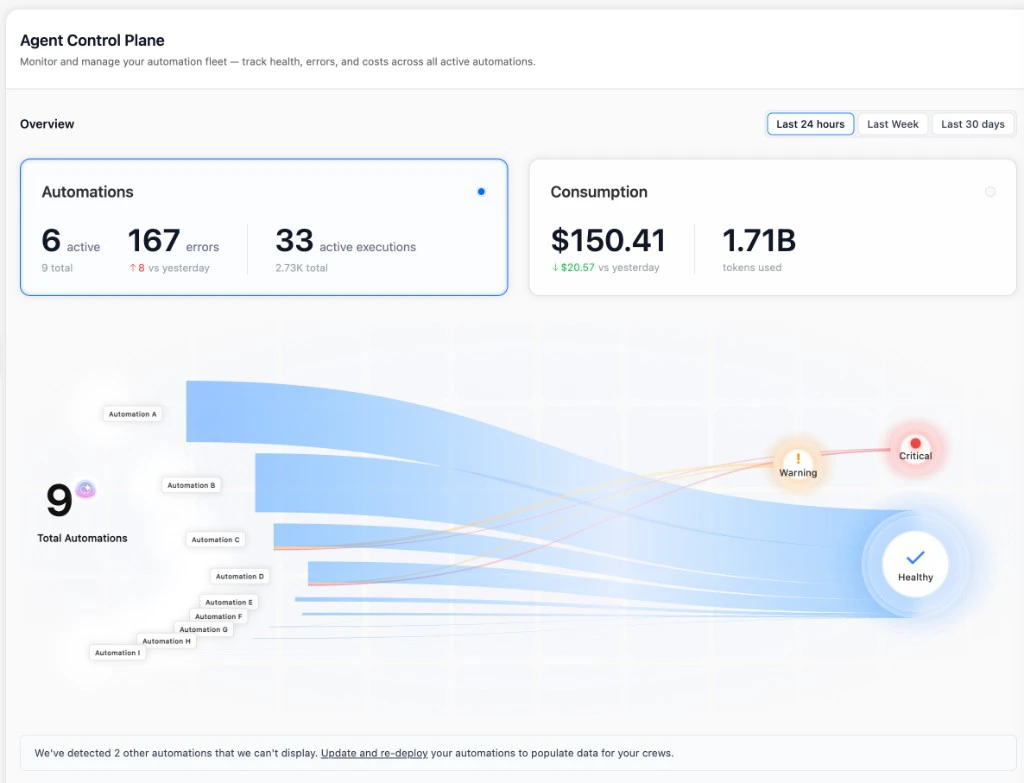
Rows only show data for deployments on crewAI v1.13 or higher — older deployments appear in the “We’ve detected N other automations that we can’t display” banner under the sankey and contribute zero metrics until they’re updated and re-deployed. See Overview — Requirements.
Dashboard
The header of the page has two metric cards and an interactive sankey. Clicking either card switches the sankey between two modes:- Health mode —
Total Automations → status buckets (Critical / Warning / Healthy). Click a bucket to filter the Automations table to just those deployments. - Consumption mode —
Model Providers → Automations → Total Cost. Click a provider to filter the Consumption table to that provider.
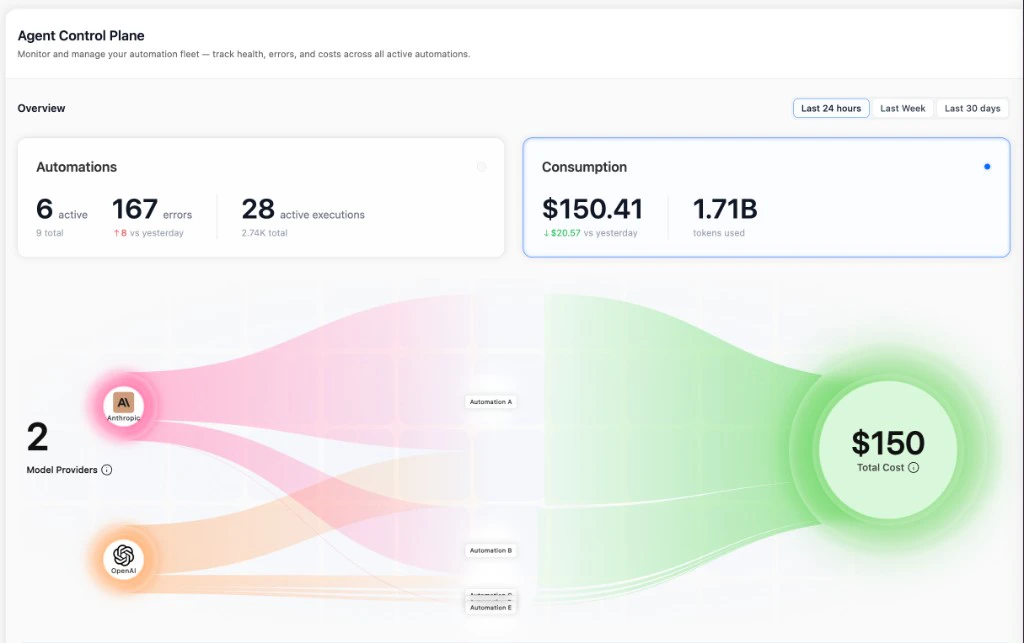
Automations table
The Automations sub-tab is the per-deployment breakdown of fleet health. Each row is one deployed crew or flow.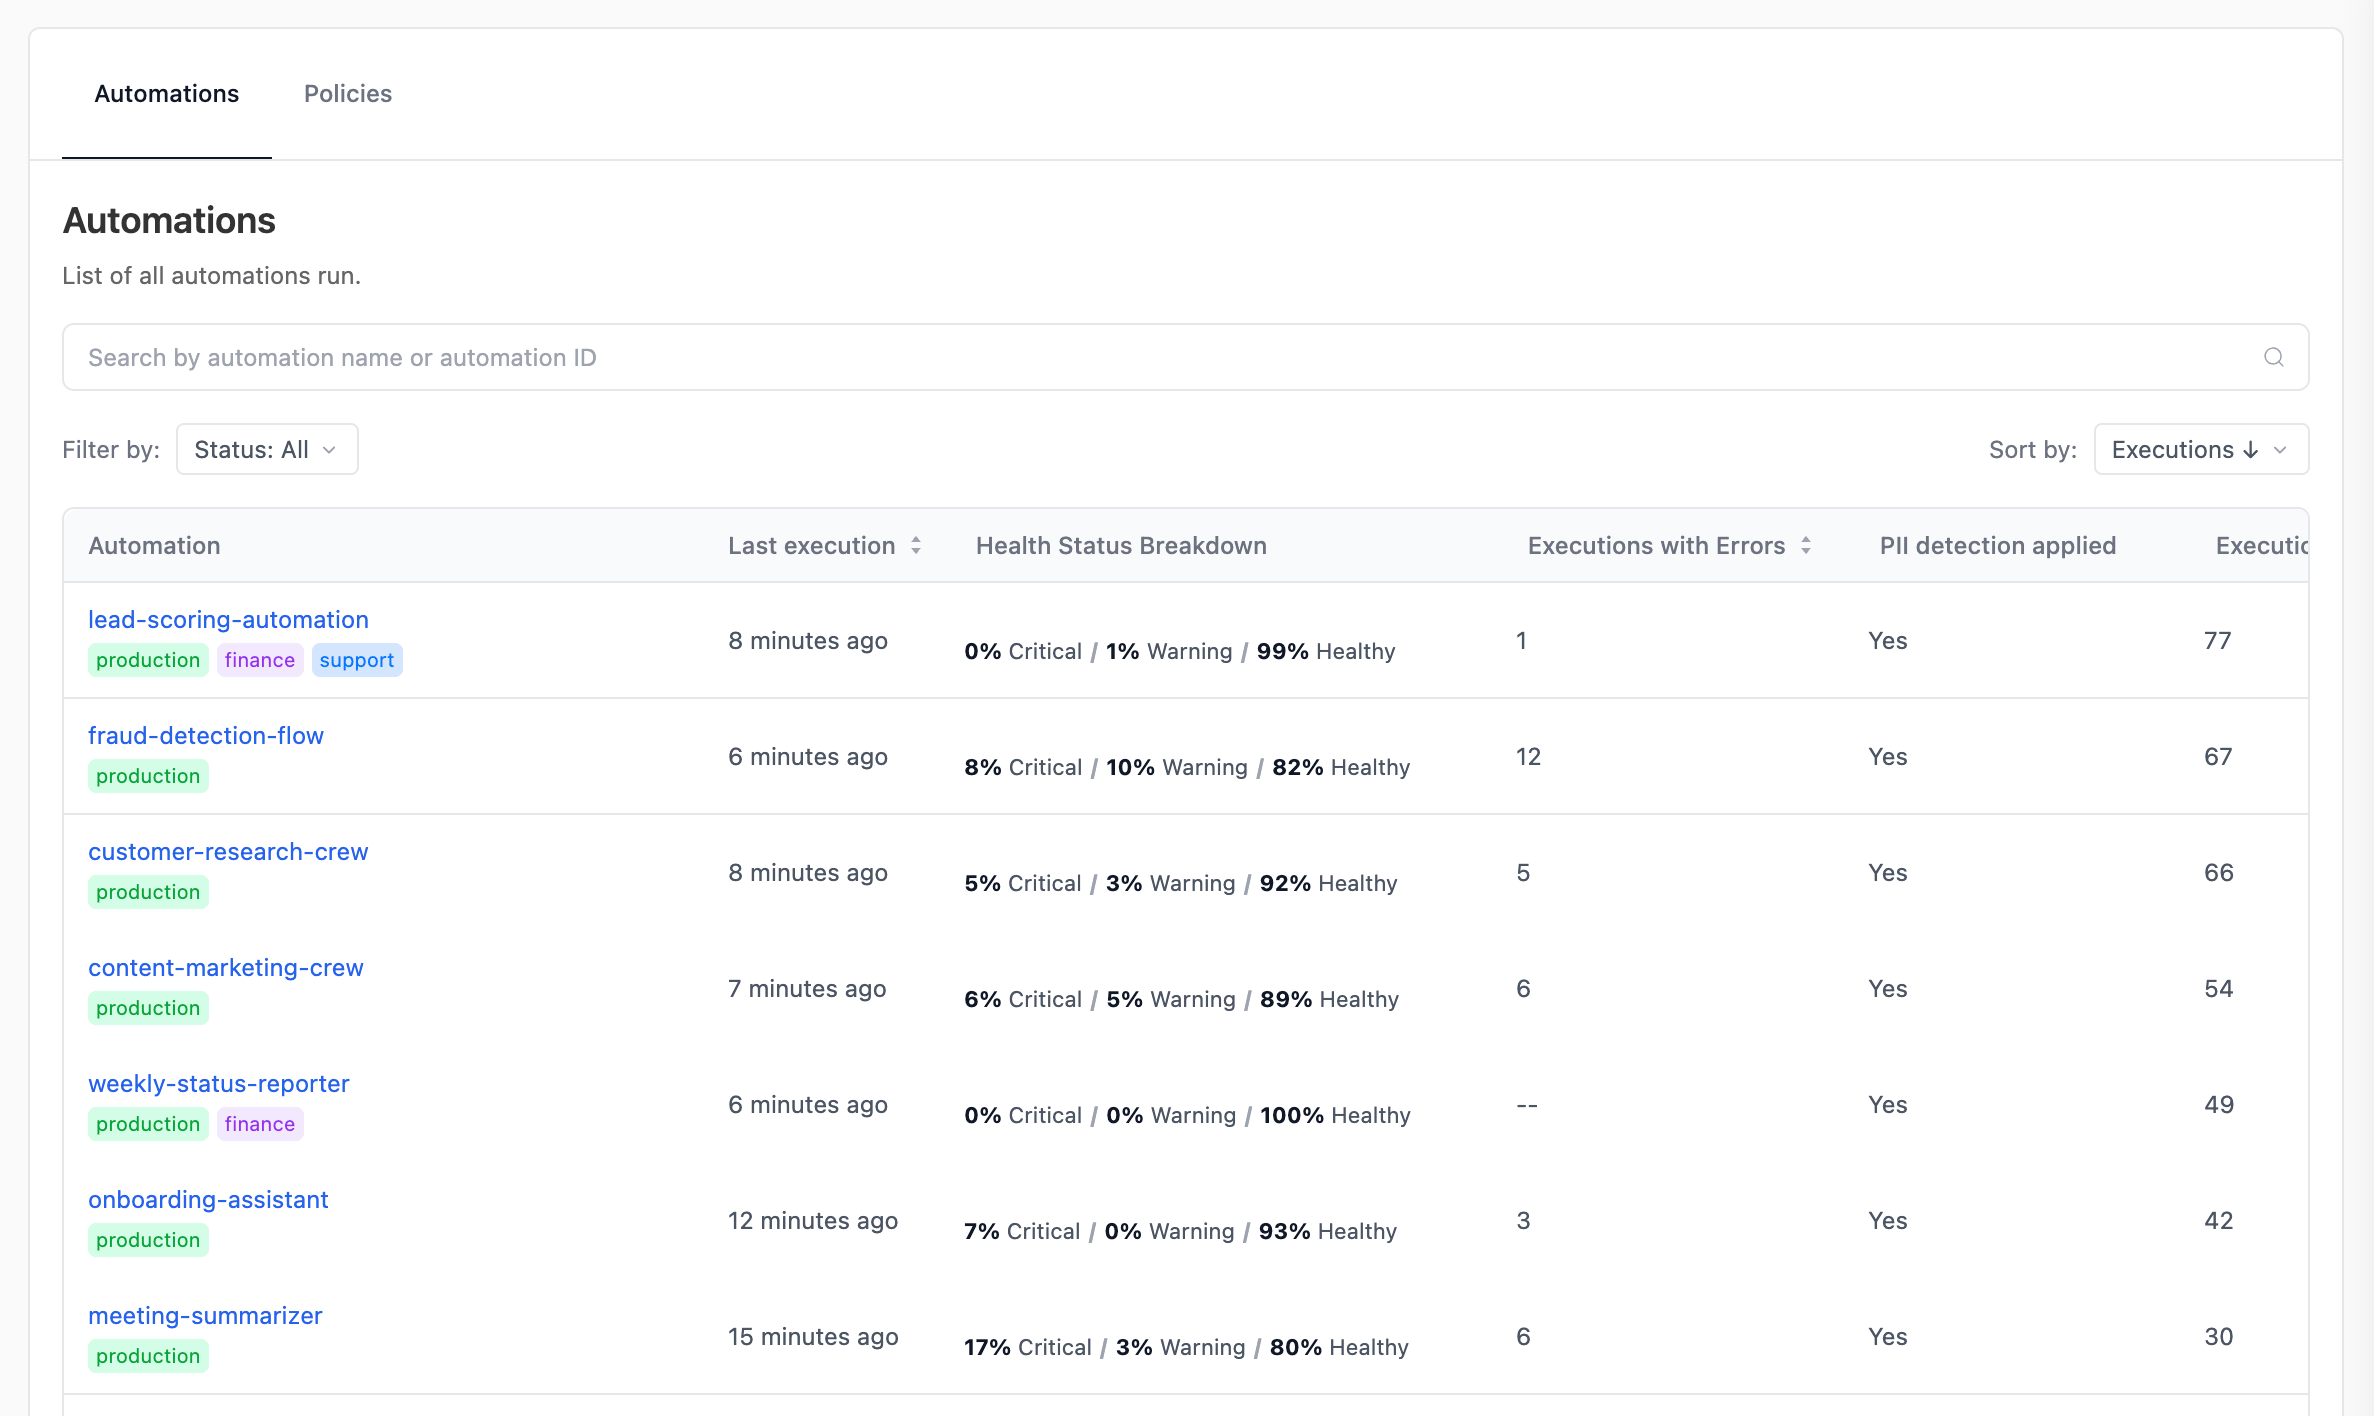
Search by name, filter by
Status (Healthy / Warning / Critical), and sort by any column header. Click a deployment name to open the Automation panel (see below).
Consumption table
The Consumption sub-tab is the per-deployment breakdown of LLM spend and token usage.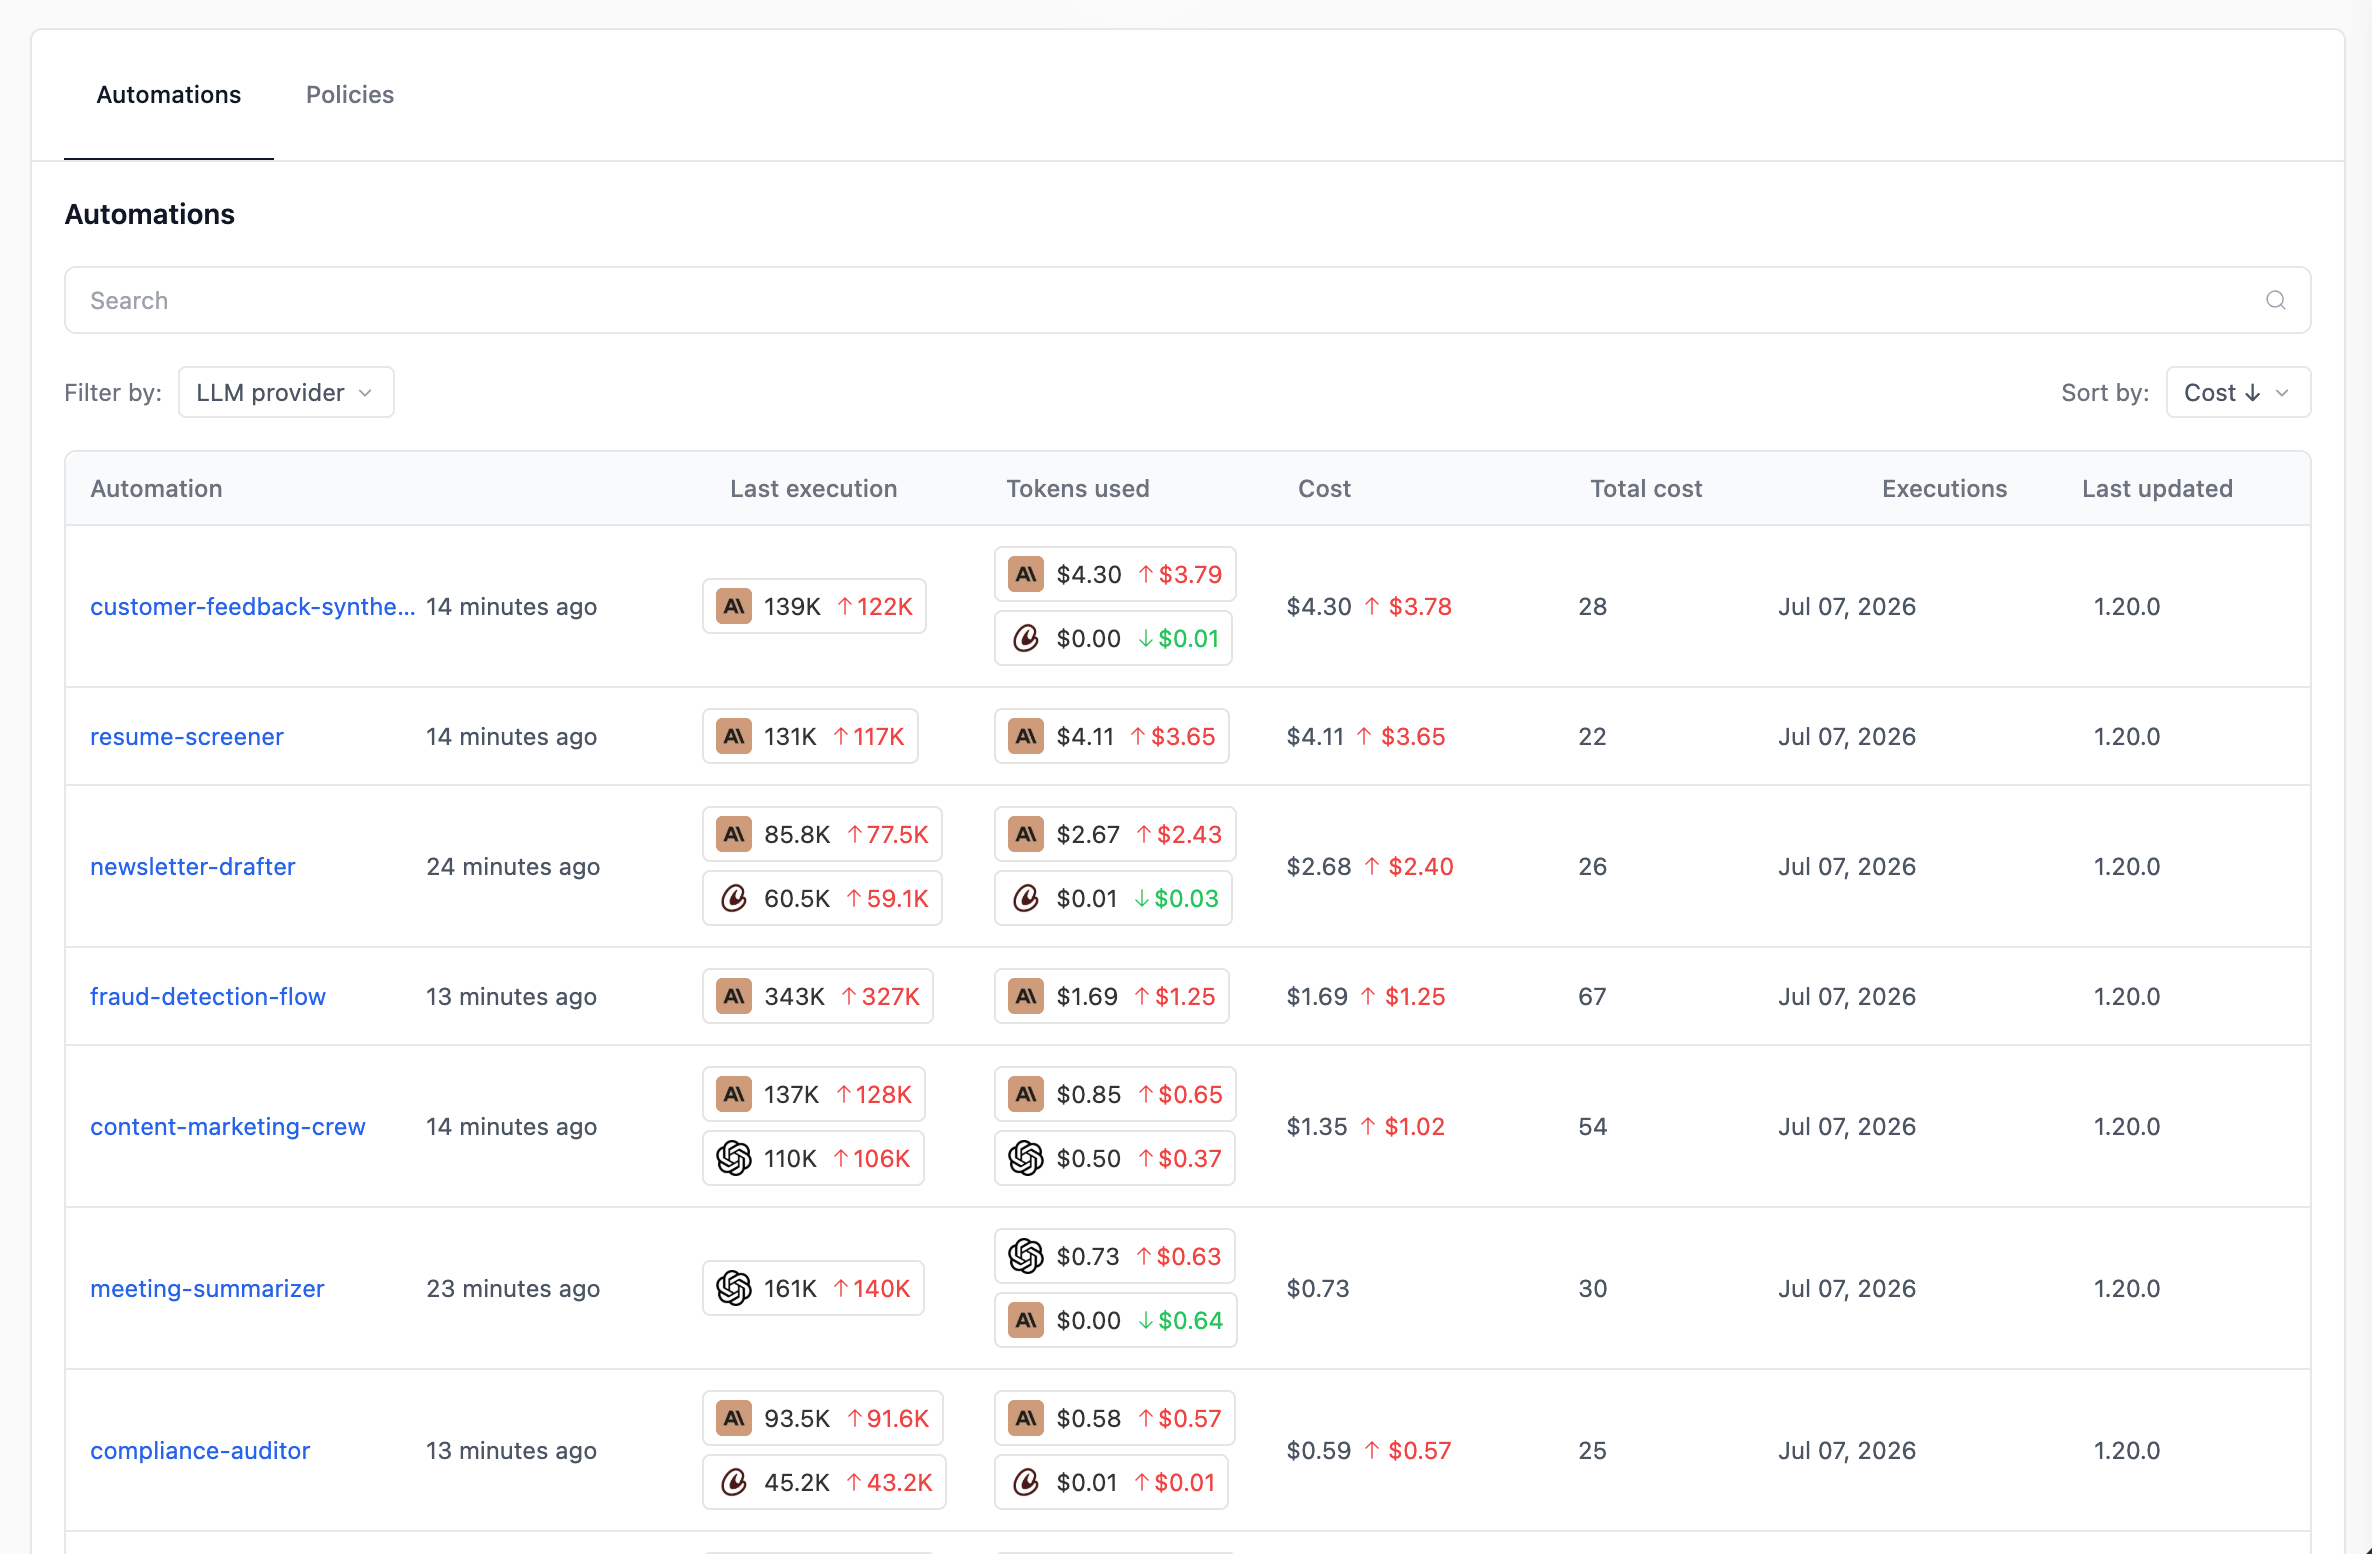
Filter by LLM provider and sort by
Cost, Executions, or Last run.
Empty cells (
— or $0.00) usually mean the deployment is below crewAI v1.13. In the screenshot above, Automation F (1.7.0) and Automation I (1.12.2) show blanks for tokens and cost — their executions still run, but they don’t emit the provider-level telemetry that powers this table. Update and re-deploy these crews to start collecting consumption data.Related
Agent Control Plane — Overview
What ACP is, requirements, plan tiers, and RBAC.
Agent Control Plane — Policies
Apply organization-wide PII Redaction policies across many automations.
Traces
Drill into a single execution to see agent reasoning, tool calls, and token usage.
Deploy to AMP
Deploy a crew on a crewAI version that supports the Agent Control Plane.
Need Help?
Contact our support team for help interpreting metrics in the Agent Control Plane.