
Opik Overview
With Comet Opik, debug, evaluate, and monitor your LLM applications, RAG systems, and agentic workflows with comprehensive tracing, automated evaluations, and production-ready dashboards.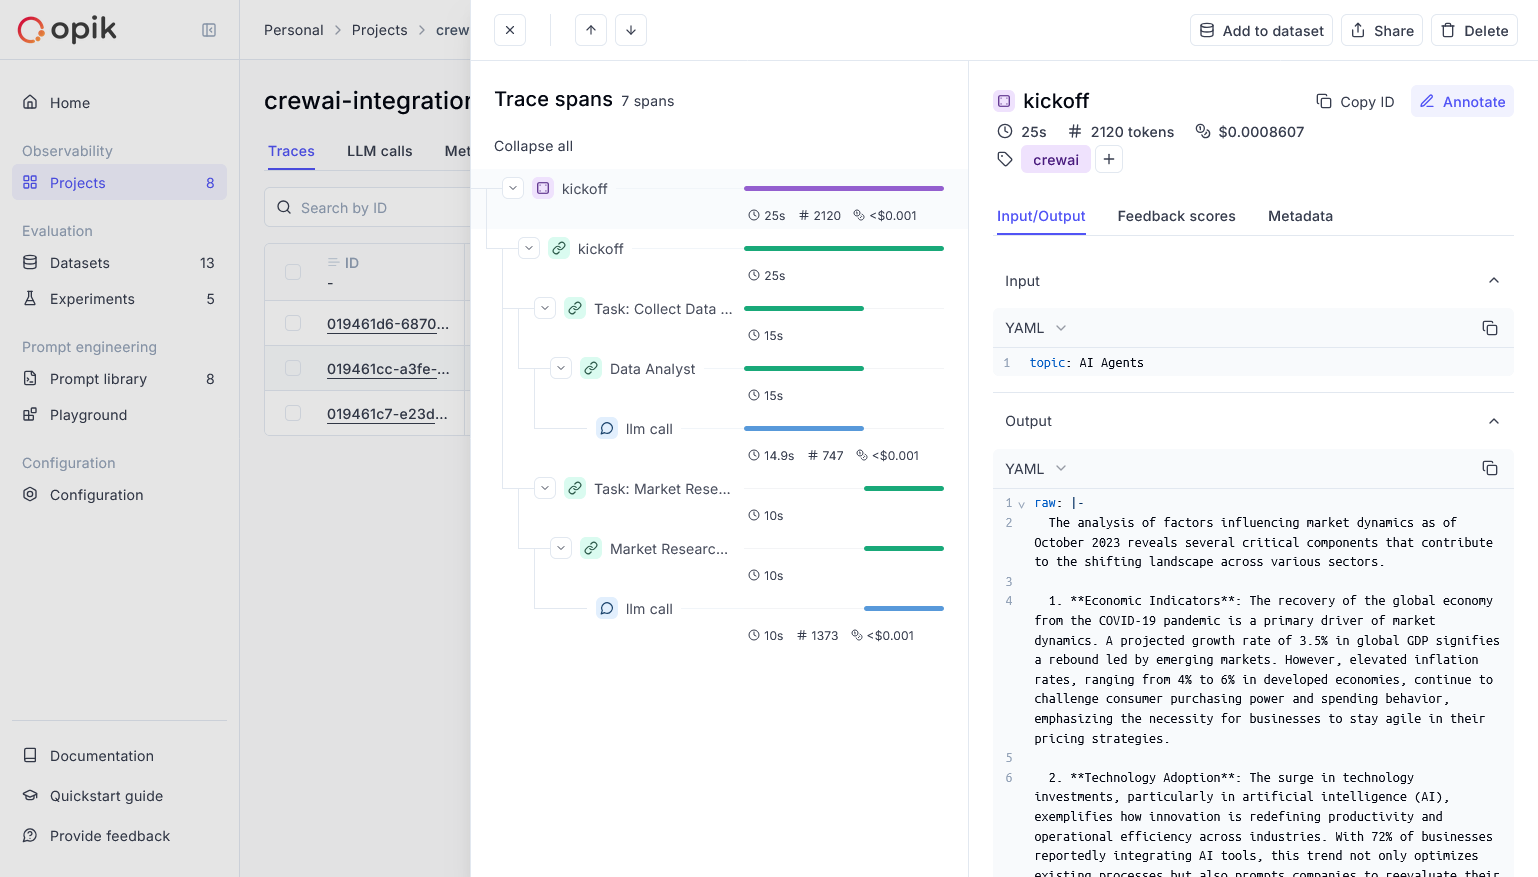
Opik Agent Dashboard
- Log Traces and Spans: Automatically track LLM calls and application logic to debug and analyze development and production systems. Manually or programmatically annotate, view, and compare responses across projects.
- Evaluate Your LLM Application’s Performance: Evaluate against a custom test set and run built-in evaluation metrics or define your own metrics in the SDK or UI.
- Test Within Your CI/CD Pipeline: Establish reliable performance baselines with Opik’s LLM unit tests, built on PyTest. Run online evaluations for continuous monitoring in production.
- Monitor & Analyze Production Data: Understand your models’ performance on unseen data in production and generate datasets for new dev iterations.
Setup
Comet provides a hosted version of the Opik platform, or you can run the platform locally. To use the hosted version, simply create a free Comet account and grab you API Key. To run the Opik platform locally, see our installation guide for more information. For this guide we will use CrewAI’s quickstart example.1
Install required packages
2
Configure Opik
3
Prepare environment
First, we set up our API keys for our LLM-provider as environment variables:
4
Using CrewAI
The first step is to create our project. We will use an example from CrewAI’s documentation:Now we can import Opik’s tracker and run our crew:After running your CrewAI application, visit the Opik app to view:
- LLM traces, spans, and their metadata
- Agent interactions and task execution flow
- Performance metrics like latency and token usage
- Evaluation metrics (built-in or custom)