
الترجمة قيد التقدم — يتم عرض المحتوى باللغة الإنجليزية.
For vendor-neutral observability via any OTLP backend (Grafana, Honeycomb, your own collector), see OpenTelemetry Export.
Choose a path
CrewAI supports two log-ingestion paths to Datadog — both are first-class and produce the same structured facets that power the dashboard. Pick the one that fits your infrastructure.- Datadog Agent
- Datadog OTLP intake
The Datadog Agent runs alongside your CrewAI containers (typically as a DaemonSet on Kubernetes) and tails their stdout. With
CREWAI_LOG_FORMAT=json set, each log event ships as a single billable line with structured attributes.Setup:- Run the Datadog Agent next to your CrewAI containers — see Datadog’s deployment docs for Kubernetes, ECS, or VM setup. Enable log collection (
logs_enabled: true) and container log collection (logs_config.container_collect_all: true). - Set
CREWAI_LOG_FORMAT=jsonas an automation environment variable in CrewAI AMP (open your automation → Settings → Environment Variables) so each log event is a single line instead of a multi-line traceback. AMP propagates the value to every container in the deployment (API + workers) — don’t set it on the container or host directly. See Enabling JSON output below for the AMP UI walkthrough and the log schema reference for the full field contract. - Confirm logs arrive in Datadog Logs with the JSON fields parsed — see Verify ingestion.
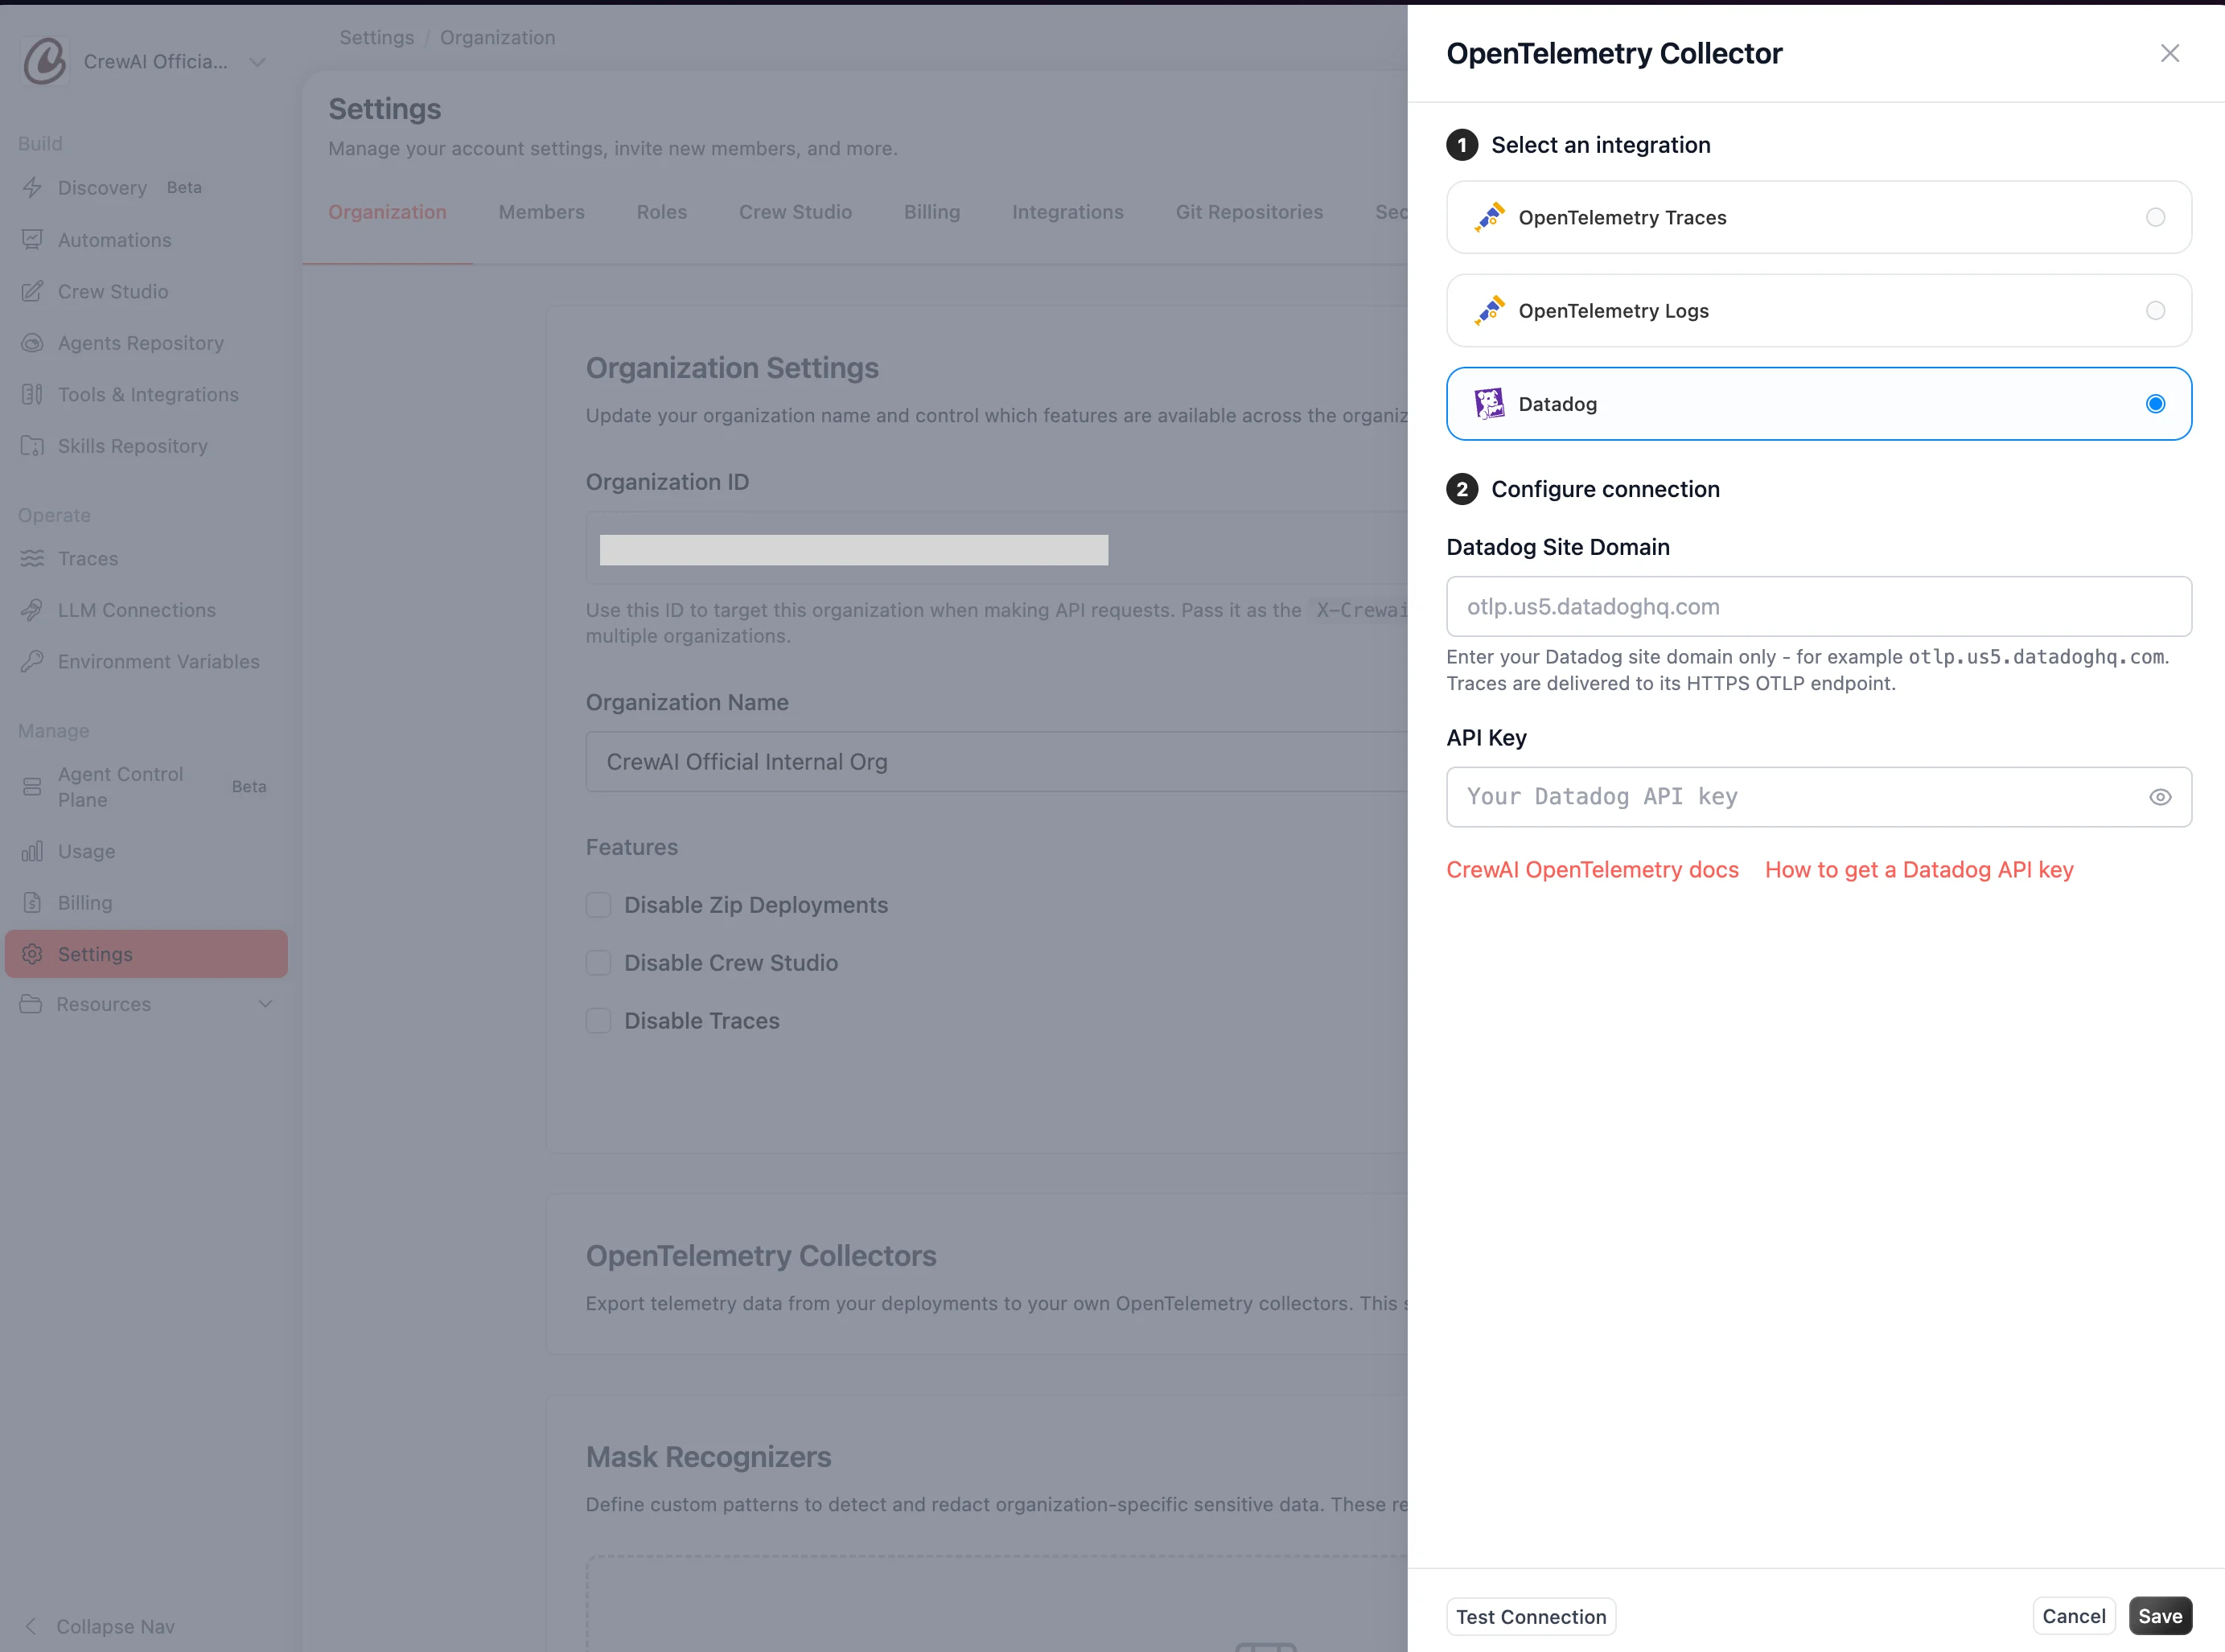
@automation_id, @kickoff_id, @execution_id, @automation_name, @crewai_version, @exception.type, @gen_ai.*), so the dashboard works identically with either choice.
Log schema reference
This schema applies to the Datadog Agent path — stdout JSON logs produced when
CREWAI_LOG_FORMAT=json is set. Logs delivered via the Datadog OTLP intake use OpenTelemetry attribute names and may differ; see OpenTelemetry Export.CREWAI_LOG_FORMAT=json is set, every log event is emitted as a single JSON object per line to stdout, with internal newlines escaped. The format is plain JSON — Datadog parses it natively, and the same payload is also consumable by Splunk, Loki, Elasticsearch, and CloudWatch without custom log pipelines.
Why JSON output
Lower ingestion cost
Most managed log backends bill per event. A Python traceback in text format is counted as one event per line — 30+ events for a single error. JSON output collapses each traceback into a single event with the stack trace as an escaped string field.
Structured search
Search by
@automation_id, @exception.type, @kickoff_id instead of grepping free-text. Build dashboards on typed facets without parser configuration.APM ↔ logs correlation
Every event carries
trace_id and span_id when fired inside a recording span, so backends auto-link logs to traces.Stable contract
The
schema field gates compatibility — within v1, fields are added but never renamed or removed.Enabling JSON output
CREWAI_LOG_FORMAT=json must be set as an automation environment variable in CrewAI AMP — it is not a container, host, or Docker setting. Open your automation in AMP, click the Settings icon, and add the variable under the Environment Variables section. AMP applies the value to every container in the deployment (API + workers) on the next restart. See Update Your Crew for the full UI walkthrough with screenshots.
The default value is
text, which preserves the legacy human-readable line format byte-for-byte. Setting any value other than json falls back to text mode. There is no migration step — the variable is read at process start and the format switches immediately.Example events
A single info-level log inside an active automation kickoff:Schema v1 fields
Within thev1 schema, fields are only added, never renamed or removed. New fields will appear as soon as a deployment is upgraded.
Stability promise
Theschema field declares the contract. Within v1, CrewAI commits to:
- Never removing a field that customers may have built queries or dashboards against.
- Never renaming a field in place — renames happen via a schema bump (e.g.
v2), with the old name kept as a deprecated alias for at least one release cycle. - Adding new fields at any time. Consumers should ignore unknown top-level keys.
v2 is introduced, both the schema field and the migration guide will be published in advance, and v1 will continue to be emitted for one release cycle so dashboards and queries have time to migrate.
Prerequisite: promote facets
Datadog auto-discovers fields the first time it sees them but doesn’t make them queryable in widgets until they’re promoted to facets. This is a one-time setup in your Datadog account.1
Search for a CrewAI log
Open Logs Explorer and search
service:crewai*. You should see at least one log event.2
Promote each field
Click any log entry to open the right-hand details panel. For each field below, hover the field name → click the gear icon → Create facet.
automation_id,automation_name,execution_id,kickoff_id,task_idcrewai_version,model_idexception.type,exception.message
gen_ai.usage.input_tokens, gen_ai.usage.output_tokens, and gen_ai.request.model facets are typically promoted automatically by Datadog’s LLM Observability auto-discovery, but verify they exist before importing the dashboard.Import the dashboard
1
Download the dashboard JSON
Save
datadog_dashboard.json to your machine.2
Open the import dialog in Datadog
Navigate to Dashboards → New Dashboard. Click the gear icon in the top right of the empty dashboard and select Import Dashboard JSON.
3
Paste or upload the JSON
Paste the contents of
datadog_dashboard.json into the import dialog (or drag the file in). Click Import.Datadog creates the dashboard immediately and lands you on it. The first load may show empty widgets for a few seconds while queries execute against the time range.What you get
The dashboard is organized into four sections plus a placeholder for a custom drill-down widget:
Three template variables at the top of the dashboard re-scope every widget at once:
$automation— filter to a single automation by name.$version— filter to a singlecrewaiSDK version (useful for comparing pre- and post-upgrade behavior).$service— filter to a specific Datadogservicetag (useful when multiple CrewAI deployments share one Datadog account).
Verify ingestion
Open Logs Explorer and run a query that matches your ingestion path:- Datadog Agent
- Datadog OTLP intake
Search
service:crewai* @schema:v1. You should see structured logs with the JSON fields parsed into Datadog facets. Pick a recent event and verify it has @automation_id, @kickoff_id, @execution_id, @crewai_version, and (when running inside a span) @trace_id / @span_id populated.If nothing appears, confirm CREWAI_LOG_FORMAT=json is set under your automation’s Environment Variables in AMP, the deployment was restarted after the change, and the Datadog Agent is tailing container stdout.Customize
The dashboard ships with deliberate gaps so you can extend it without uninstalling and re-importing.Add a Recent Errors log stream
The Drill-Down section is intentionally empty. Add a Log Stream widget to it for an inline view of recent failures:- Edit the dashboard and click + Add Widgets inside the Drill-Down group.
- Drag in a Log Stream widget.
- Set the filter query to
status:error $automation $version $service. - Choose columns:
@timestamp,@automation_name,@exception.type,@exception.message,@execution_id. - Sort by most recent, limit to 25 entries.
Add p95 latency
Logs don’t include execution duration by default. Two ways to add a latency widget:- From APM traces — if you also export OTLP traces to Datadog, add a Timeseries widget with data source Traces, query
service:crewai*, aggregationp95 of @duration. Datadog APM auto-tracks span duration. - From metric extraction — extract a
flow.duration_msmetric from logs via Datadog’s log-to-metric pipeline, then chart it like any other metric. Useful if you don’t run APM.
Re-scope to multiple deployments
The$service template variable defaults to * and will catch every CrewAI deployment in your Datadog account. Change the default to a specific service name in Configure → Template Variables if you want the dashboard to focus on one deployment by default.
Troubleshooting
Next steps
OpenTelemetry Export
Vendor-neutral observability for non-Datadog stacks (Grafana, Honeycomb, your own collector) — or as a Datadog complement when you want to fan out telemetry to multiple backends.
Datadog Log Search Syntax
Reference for customizing widget queries against the structured facets above.